In the paper
Exploring
the evolutionary paths of the most massive galaxies since
z~2 (ApJ 2008, 687, 50), we have analyzed the
Spitzer/MIPS 24 μm emission of a sample of massive
galaxies (M>10
11 M
⊗) at
0≤z≤2 segregated by morphology.
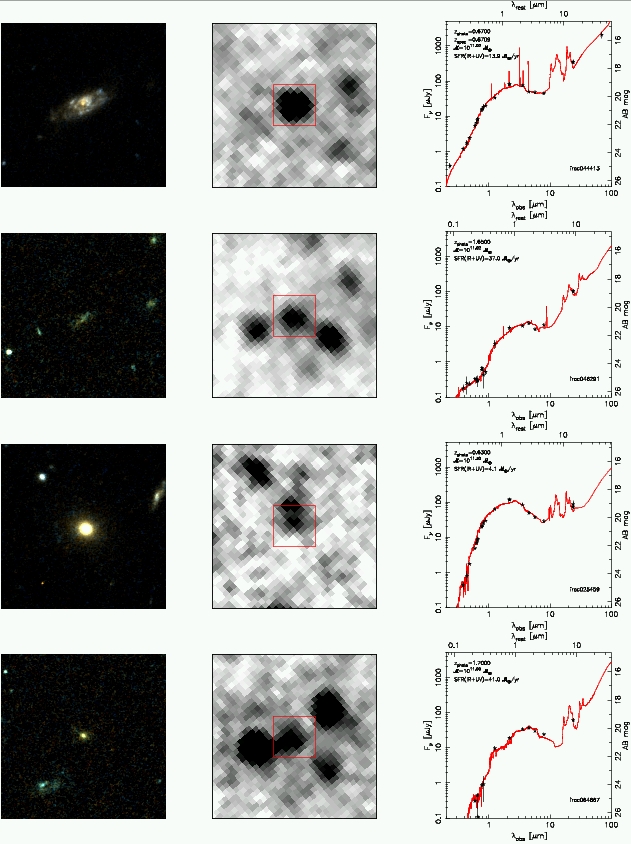
The two figures above are extracted from this paper. The
first figure (left) depicts 4 examples of the galaxies in
our sample. Left panels show 10"×10" RGB composite
images built from HST/ACS v and i frames. In the middle
column, MIPS 24 μm images of size 40"×40" are
depicted, with the red square showing the area covered by
the ACS postage stamp. In all images, North is up and East
is left. The right columns show the SEDs of each galaxy,
fitted to stellar population and dust emission models which
are used to estimate photometric redshifts, stellar masses
and SFRs (these parameters are given in each SED plot). The
two upper rows show examples of disk-like galaxies:
EGS142126.97+531137.4, a galaxy at z=0.67; and
EGS142013.18+525925.0, lying at z=1.65. The two lower rows
show examples of spheroid-like galaxies:
EGS142021.47+525543.4, a galaxy at z=0.63, and
EGS142125.76+531622.8, placed at z=1.70.
Interestingly, not only most (more than 90%) disk-like
massive galaxies are detected by MIPS (revealing the
presence of dust-enshrouded star formation in these
systems), but also around 50% of spheroids have MIPS
counterparts, especially at z>1, even when rest-frame
optical colors reveal that they are dead and evolving
passively.
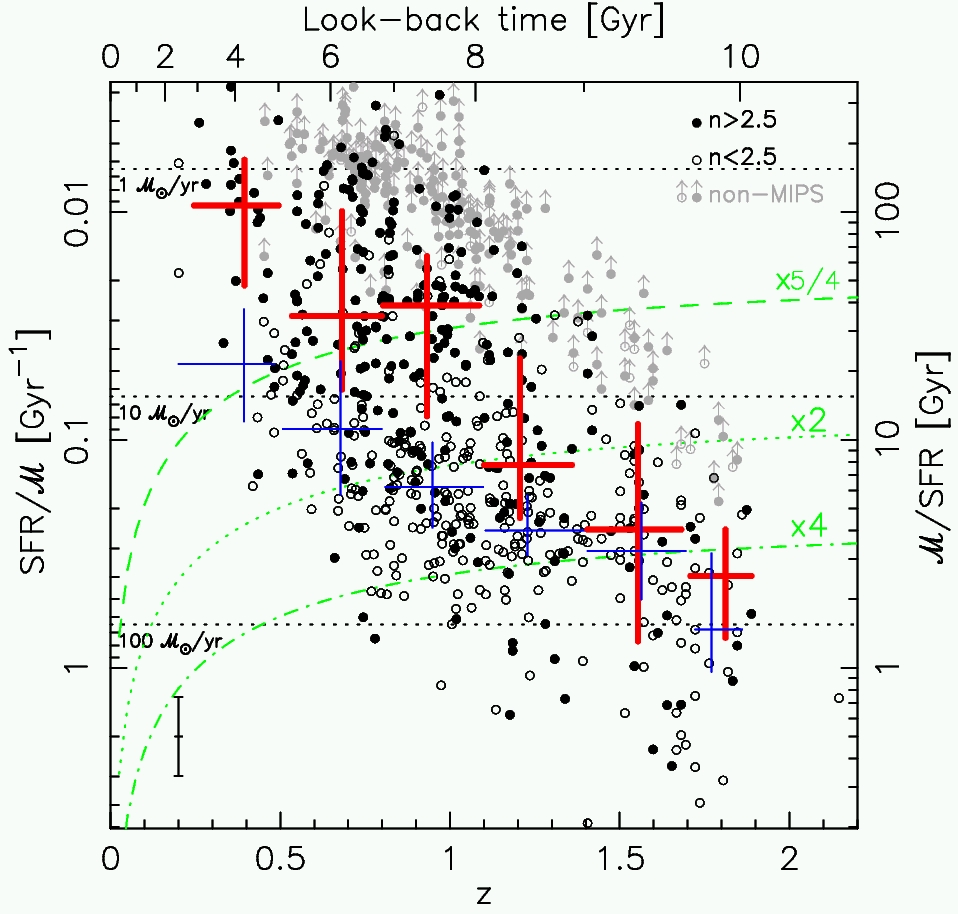
The second figure above (right) shows the specific SFRs as a
function of redshift and morphology (for galaxies not
identified as AGN) for our sample. Galaxies detected at 24
μm are plotted with open (disks) and filled (spheroids)
black circles, while gray symbols show upper limits for
sources not detected by MIPS. Red and blue crosses represent
the median and quartiles for the distribution of specific
SFRs in different redshift ranges. The red widest lines
refer to spheroids and the blue narrowest lines to disky
galaxies. Green curves show the expected positions of
galaxies which would multiply their stellar mass by 5/4, 2,
and 4 between their redshift and z=0 if they maintained a
constant SFR. Horizontal dashed lines show constant SFR
values for the median stellar mass of our sample
(1.6×10
11 M
⊗).
Based on the measured specific SFRs, we estimate that MIPS
detected spheroid-like galaxies have doubled (at the most,
depending on the burst durations) their stellar mass due to
newly-born stars alone from z=2 to z=0.2. Most of this mass
increase (60%) occurs at z>1, where specific SFRs are as
high as 0.4 Gyr
-1. Disk-like galaxies have
tripled (at the most) their stellar mass by newly-formed
stars at z<2, with a more steady growth rate as a function
of redshift.
These figures contrast with the size increments measured by
Trujillo et al. (2007) for the same sample: massive
spheroid-like galaxies have increased their size up to a
factor of ~5.5 from z=2 to z=0 (10 Gyr), while massive disks
have increased their size by a ~2.5 factor in the same
period. If star formation works in the same way in making
both spheroid and disk-like galaxies grow in size, clearly
there should be another mechanism (mergers?, adiabatic
expansion?) helping (more noticeably) the spheroids (which
form less new stars than disks between z=2 and the present,
but grow more) to increase their size.
Previous papers in this webpage
The Stellar Mass Assembly of Galaxies from z = 0 to z = 4:
Analysis of a Sample Selected in the Rest-Frame
Near-Infrared with Spitzer
Created on Wed Jun 10 16:13:02 CEST 2009
Back to top
