In [3]:
# display full image
ximshow(image_dataJ, z1z2=(-500,500),
cbar_orientation='vertical',
title='NGC7798 (grism J)')

The starting point are the images created by PyEmir, as explained in the tutorial:
https://guaix-ucm.github.io/pyemir-tutorials/tutorial_mos/ngc7798.html
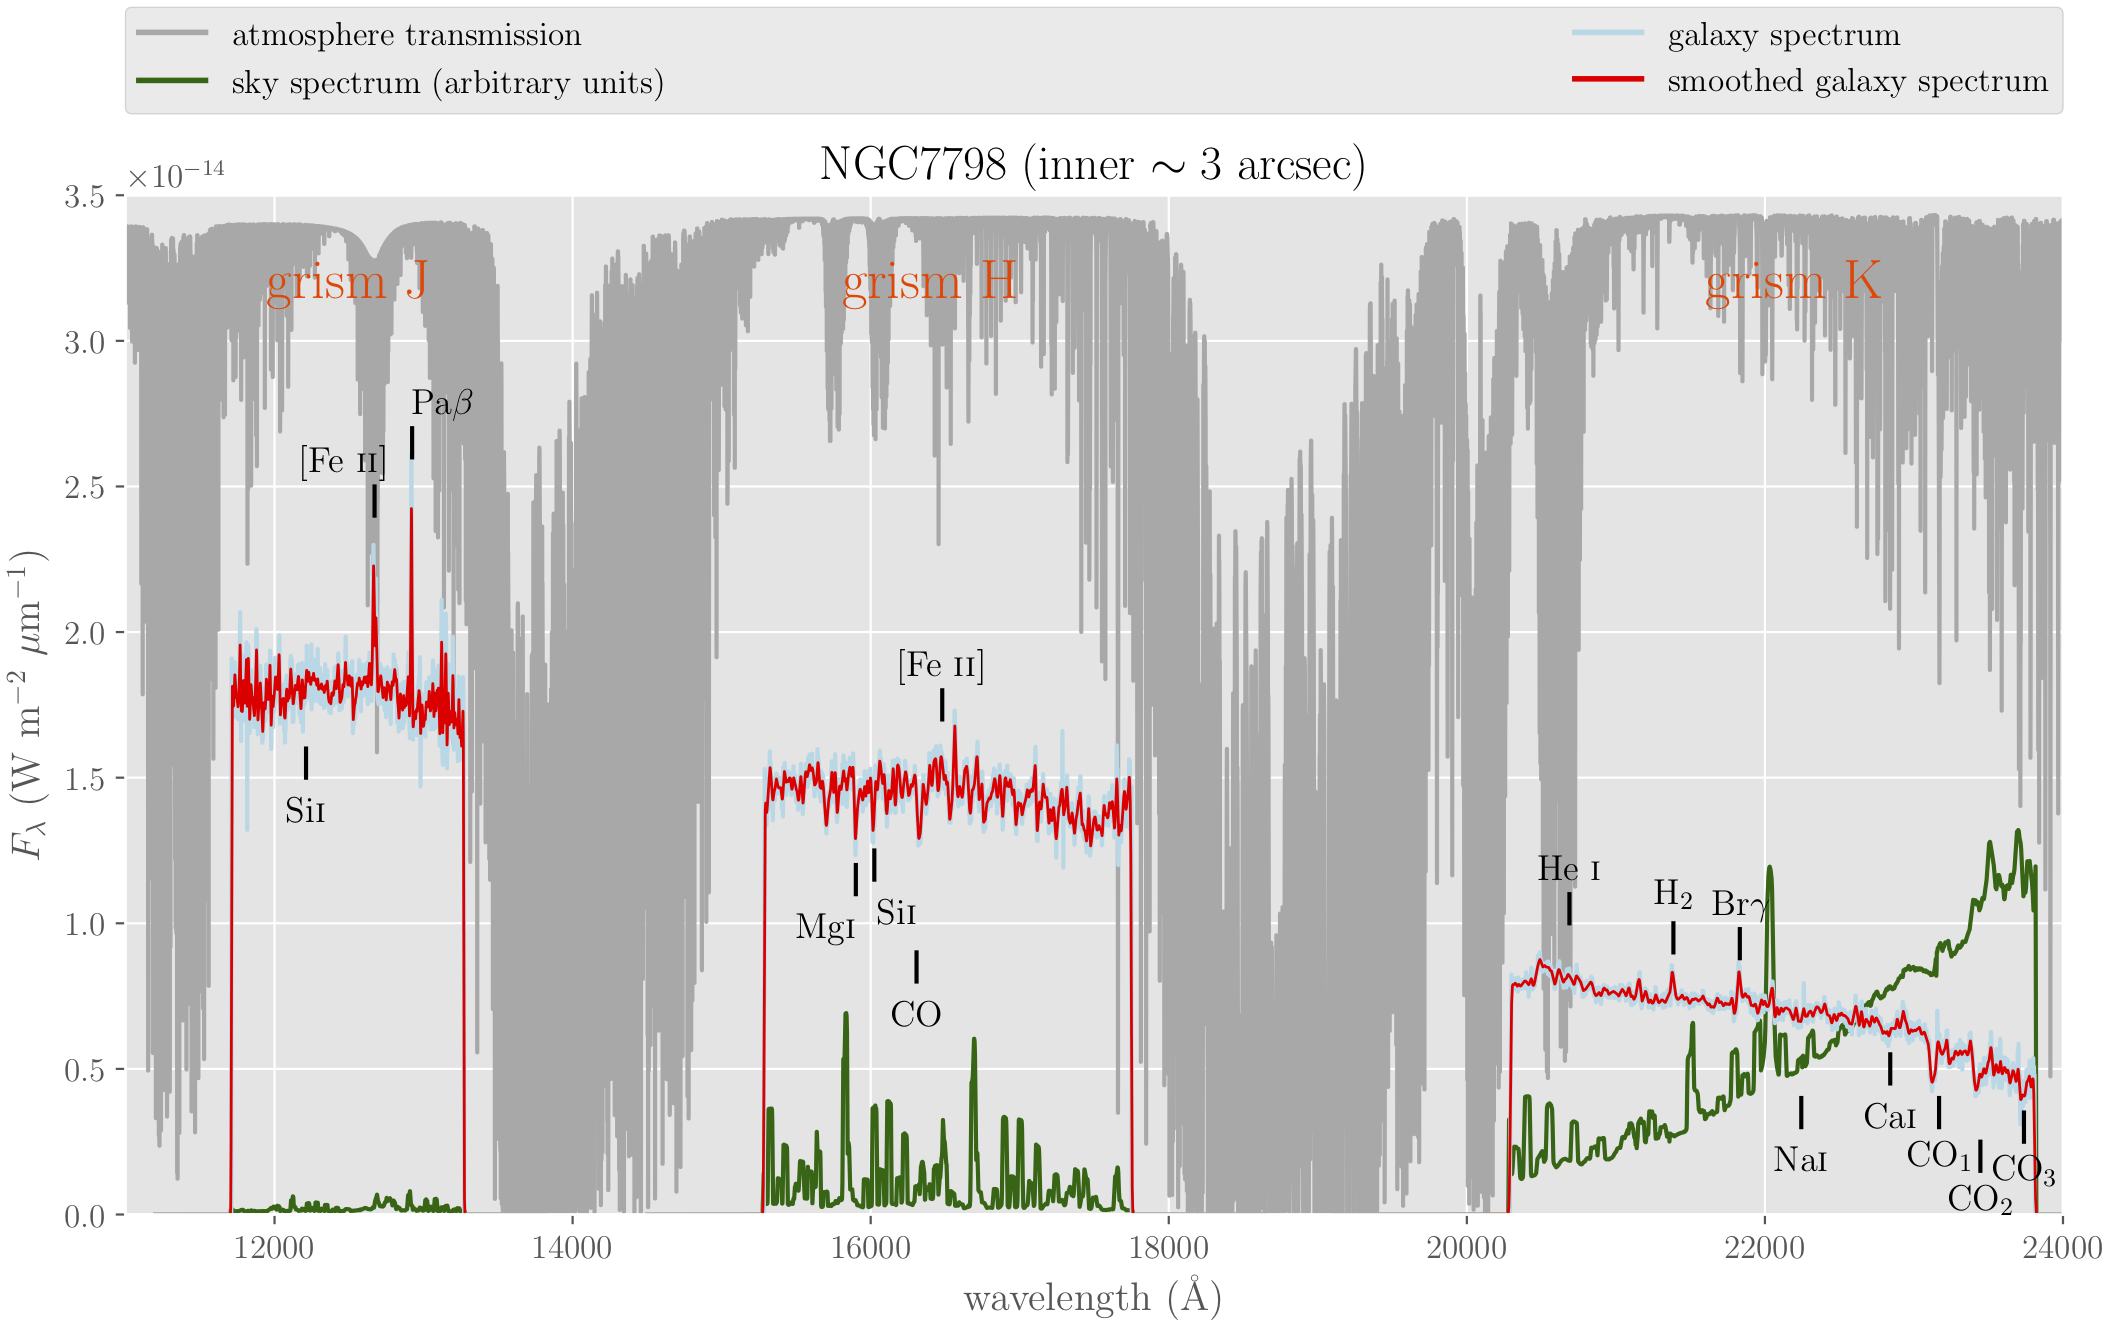
The final results are the flux calibrated spectra of NGC7798 in the J, H and K bands.
from astropy.io import fits
import matplotlib.pyplot as plt
import numpy as np

from numina.array.display.ximshow import ximshow
from numina.array.display.ximplotxy import ximplotxy
with fits.open('grismJ_ngc7798_A-B.fits', mode='readonly') as hdulist:
    image_headerJ = hdulist[0].header
    image_dataJ = hdulist[0].data

# image dimensions
naxis2, naxis1 = image_dataJ.shape

# read wavelength calibration from header
crpix1 = image_headerJ['crpix1']
crval1 = image_headerJ['crval1']
cdelt1 = image_headerJ['cdelt1']
exptime = image_headerJ['exptime']
print('crpix1, crval1, cdelt1:', crpix1, crval1, cdelt1)
print('exptime:', exptime)
crpix1, crval1, cdelt1: 1.0 11200.0 0.77
exptime: 119.991601
# display full image
ximshow(image_dataJ, z1z2=(-500,500),
        cbar_orientation='vertical',
        title='NGC7798 (grism J)')
ximshow(image_dataJ, image_bbox=(600,2750,1500,1600),
        cbar_orientation='vertical',
        z1z2=(-500,500), title='NGC7798 (grism J)')

ximshow(image_dataJ, image_bbox=(600,2750,550,650),
        cbar_orientation='vertical',
        z1z2=(-500,500), title='NGC7798 (grism J)')

# extract and coadd individual spectra by coadding rows
sp1 = np.sum(image_dataJ[1545:1555,], axis=0)
sp2 = -np.sum(image_dataJ[591:601,], axis=0)
# sum of two spectra
spectrumJ = sp1 + sp2
# compute counts/second
spectrumJ = spectrumJ / (2 * exptime)
# plot spectrum
fig, ax = plt.subplots()
waveJ = crval1 + (np.arange(1, naxis1 + 1) - crpix1) * cdelt1
ax.plot(waveJ, spectrumJ)
wvminJ = 11710
wvmaxJ = 13270
ax.set_xlim([wvminJ, wvmaxJ])
ax.set_xlabel('wavelength (Angstrom)')
ax.set_ylabel(r'count rate (ADU s$^{-1}$)')
ax.set_title('NGC7798 (grism J)')
Text(0.5, 1.0, 'NGC7798 (grism J)')

# save spectrum into FITS file
hdu_sp = fits.PrimaryHDU(data=spectrumJ, header=image_headerJ)
hdu_sp.writeto('grismJ_ngc7798.fits', overwrite=True)
with fits.open('grismH_ngc7798_A-B.fits', mode='readonly') as hdulist:
    image_headerH = hdulist[0].header
    image_dataH = hdulist[0].data

# image dimensions
naxis2, naxis1 = image_dataH.shape

# read wavelength calibration from header
crpix1 = image_headerH['crpix1']
crval1 = image_headerH['crval1']
cdelt1 = image_headerH['cdelt1']
exptime = image_headerH['exptime']
print('crpix1, crval1, cdelt1:', crpix1, crval1, cdelt1)
print('exptime:', exptime)
crpix1, crval1, cdelt1: 1.0 14500.0 1.22
exptime: 119.991601
# display full image
ximshow(image_dataH, z1z2=(-1000,1000),
        cbar_orientation='vertical',
        title='NGC7798 (grism H)')

ximshow(image_dataH, image_bbox=(600,2750,1500,1600),
        cbar_orientation='vertical',
        z1z2=(-1000,1000), title='NGC7798 (grism H)')

ximshow(image_dataH, image_bbox=(600,2750,550,650),
        cbar_orientation='vertical',
        title='NGC7798 (grism H)')

# extract and coadd individual spectra by coadding rows
sp1 = np.sum(image_dataH[1545:1555,], axis=0)
sp2 = -np.sum(image_dataH[591:601,], axis=0)
# sum of two spectra
spectrumH = sp1 + sp2
# compute counts/second
spectrumH = spectrumH / (2 * exptime)
# plot spectrum
fig, ax = plt.subplots()
waveH = crval1 + (np.arange(1, naxis1 + 1) - crpix1) * cdelt1
ax.plot(waveH, spectrumH)
wvminH = 15280
wvmaxH = 17750
ax.set_xlim([wvminH, wvmaxH])
ax.set_xlabel('wavelength (Angstrom)')
ax.set_ylabel(r'count rate (ADU s$^{-1}$)')
ax.set_title('NGC7798 (grism H)')
Text(0.5, 1.0, 'NGC7798 (grism H)')

# save spectrum into FITS file
hdu_sp = fits.PrimaryHDU(data=spectrumJ, header=image_headerH)
hdu_sp.writeto('grismH_ngc7798.fits', overwrite=True)
with fits.open('grismK_ngc7798_A-B.fits', mode='readonly') as hdulist:
    image_headerK = hdulist[0].header
    image_dataK = hdulist[0].data

# image dimensions
naxis2, naxis1 = image_dataK.shape

# read wavelength calibration from header
crpix1 = image_headerK['crpix1']
crval1 = image_headerK['crval1']
cdelt1 = image_headerK['cdelt1']
exptime = image_headerK['exptime']
print('crpix1, crval1, cdelt1:', crpix1, crval1, cdelt1)
print('exptime:', exptime)
crpix1, crval1, cdelt1: 1.0 19100.0 1.73
exptime: 119.991601
# display full image
ximshow(image_dataK, z1z2=(-1000,1000),
        cbar_orientation='vertical',
        title='NGC7798 (grism K)')

The previous image reveals that the K band exposure has a problem: a ghost signal (almost vertical black feature) at the middle of the wavelength range. The pixels of the galaxy spectrum affected by this ghost should be interpolated.
ximshow(image_dataK, image_bbox=(600,2750,1500,1600),
        cbar_orientation='vertical',
        z1z2=(-1000,1000), title='NGC7798 (grism K)')

ximshow(image_dataK, image_bbox=(600,2750,550,650),
        cbar_orientation='vertical',
        title='NGC7798 (grism H)')

# extract and coadd individual spectra by coadding rows
sp1 = np.sum(image_dataK[1545:1555,], axis=0)
sp2 = -np.sum(image_dataK[591:601,], axis=0)
# sum of two spectra
spectrumK = sp1 + sp2
# compute counts/second
spectrumK = spectrumK / (2 * exptime)
# plot spectrum
fig, ax = plt.subplots()
waveK = crval1 + (np.arange(1, naxis1 + 1) - crpix1) * cdelt1
ax.plot(waveK, spectrumK)
wvminK = 20280
wvmaxK = 23810
ax.set_xlim([wvminK, wvmaxK])
ax.set_xlabel('wavelength (Angstrom)')
ax.set_ylabel(r'count rate (ADU s$^{-1}$)')
ax.set_title('NGC7798 (grism K)')
Text(0.5, 1.0, 'NGC7798 (grism K)')

The previously mentioned ghost appears clearly around 22000 Angstroms. Let's interpolate the affected pixels.
# repeat plot with horizontal scale in pixels (instead of Angstroms)
fig, ax = plt.subplots()
pixel = np.arange(naxis1)
ax.plot(pixel, spectrumK)
ax.set_xlim([1640, 1750])
ax.set_xlabel('pixel')
ax.set_ylabel(r'count rate (ADU s$^{-1}$)')
ax.set_title('NGC7798 (grism K)')
Text(0.5, 1.0, 'NGC7798 (grism K)')

# interpolate "bad pixels"
good_pixels = list(range(1640, 1740))
bad_pixels = list(range(1660, 1720))
for ipix in bad_pixels:
    good_pixels.remove(ipix)
spectrumK[bad_pixels] = np.mean(spectrumK[good_pixels])
# repeat plot with horizontal scale in pixels (instead of Angstroms)
fig, ax = plt.subplots()
pixel = np.arange(naxis1)
ax.plot(pixel, spectrumK)
ax.set_xlim([1640, 1750])
ax.set_xlabel('pixel')
ax.set_ylabel(r'count rate (ADU s$^{-1}$)')
ax.set_title('NGC7798 (grism K)')
Text(0.5, 1.0, 'NGC7798 (grism K)')

# replot spectrum (after removal of ghost feature)
fig, ax = plt.subplots()
waveK = crval1 + (np.arange(1, naxis1 + 1) - crpix1) * cdelt1
ax.plot(waveK, spectrumK)
wvminK = 20280
wvmaxK = 23810
ax.set_xlim([wvminK, wvmaxK])
ax.set_xlabel('wavelength (Angstrom)')
ax.set_ylabel(r'count rate (ADU s$^{-1}$)')
ax.set_title('NGC7798 (grism K)')
Text(0.5, 1.0, 'NGC7798 (grism K)')

# save spectrum into FITS file
hdu_sp = fits.PrimaryHDU(data=spectrumK, header=image_headerK)
hdu_sp.writeto('grismK_ngc7798.fits', overwrite=True)
# read response curve
for grism in ['J', 'H', 'K']:
    inputfile = 'grism' + grism + '_preliminary_response_curve_hd209290.fits'
    with fits.open(inputfile, mode='readonly') as hdulist:
        response_header = hdulist[0].header
        response_sp = hdulist[0].data

    # to avoid division by zero, set response curve to 1.0 where it is <= 0
    response_sp[np.where(response_sp <= 0)] = 1.0

    if grism == 'J':
        response_spJ = np.copy(response_sp)
    elif grism == 'H':
        response_spH = np.copy(response_sp)
    elif grism == 'K':
        response_spK = np.copy(response_sp)
    else:
        raise ValueError('Unexpected grism value: ' + grism)

    print('\n* ' + inputfile)
    print('grism:', grism)
    naxis1 = response_sp.shape[0]
    print('naxis1:', naxis1)
    # read wavelength calibration from header
    crpix1 = response_header['crpix1']
    crval1 = response_header['crval1']
    cdelt1 = response_header['cdelt1']
    print('crpix1, crval1, cdelt1:', crpix1, crval1, cdelt1)
* grismJ_preliminary_response_curve_hd209290.fits
grism: J
naxis1: 3400
crpix1, crval1, cdelt1: 1.0 11200.0 0.77

* grismH_preliminary_response_curve_hd209290.fits
grism: H
naxis1: 3400
crpix1, crval1, cdelt1: 1.0 14500.0 1.22

* grismK_preliminary_response_curve_hd209290.fits
grism: K
naxis1: 3400
crpix1, crval1, cdelt1: 1.0 19100.0 1.73
# plot spectrum and response curve
for grism, wvmin, wvmax, wave, spectrum, response_sp in zip(['J', 'H', 'K'],
                                                      [wvminJ, wvminH, wvminK],
                                                      [wvmaxJ, wvmaxH, wvmaxK],
                                                      [waveJ, waveH, waveK],
                                                      [spectrumJ, spectrumH, spectrumK],
                                                      [response_spJ, response_spH, response_spK]):
    fig, ax = plt.subplots()
    ax.plot(wave, spectrum, label='observed spectrum')
    ax.set_xlabel('wavelength (Angstrom)')
    ax.set_ylabel(r'count rate (ADU s$^{-1}$)')
    ax.set_title('NGC7798 (grism ' + grism + ')')
    ax.legend(loc=3)
    ax2 = ax.twinx()
    ax2.plot(wave, response_sp, 'C1-', label='smoothed response curve')
    ax2.set_ylabel('response curve\n' + r'(ADU s$^{-1}$) / (W m$^{-2} \mu\rm{m}^{-1}$)', color='C1')
    ax2.legend(loc=4)
    ax2.set_xlim([wvmin, wvmax])


# flux calibration of the galaxy spectrum
yfluxedJ = spectrumJ / response_spJ
yfluxedH = spectrumH / response_spH
yfluxedK = spectrumK / response_spK

# set to zero spectrum beyond displayed limits
iok = np.concatenate((np.where(waveJ < wvminJ), np.where(waveJ > wvmaxJ)), axis=None)
yfluxedJ[iok] = 0.0
iok = np.concatenate((np.where(waveH < wvminH), np.where(waveH > wvmaxH)), axis=None)
yfluxedH[iok] = 0.0
iok = np.concatenate((np.where(waveK < wvminK), np.where(waveK > wvmaxK)), axis=None)
yfluxedK[iok] = 0.0
In order to help in the identification of potential absorption features in the galaxy spectrum, we download the Arcturus' spectrum (which will be overplotted in the corresponding plots).
# read Arcturus (HD124897, K1.5 III) spectrum
tab_arcturus = np.genfromtxt(
    "http://irtfweb.ifa.hawaii.edu/~spex/IRTF_Spectral_Library/Data/K1.5IIIFe-0.5_HD124897_lines.txt"
)
xtab = tab_arcturus[:,0] * 10000  # convert from micron to Angstrom
ytab = tab_arcturus[:,1]

# resample Arcsturus spectrum to the same sampling as the galaxy spectrum
z = 0.008202
from scipy.interpolate import interp1d
funinterp_arcturus = interp1d(xtab*(1+z), ytab, kind="linear")
# plot
for grism, wvmin, wvmax, wave, yfluxed, response_sp, factor, ylim in zip(
    ['J', 'H', 'K'],
    [wvminJ, wvminH, wvminK],
    [wvmaxJ, wvmaxH, wvmaxK],
    [waveJ, waveH, waveK],
    [yfluxedJ, yfluxedH, yfluxedK],
    [response_spJ, response_spH, response_spK],
    [8, 9, 10],
    [2.7, 2.0, 1.1]
):
    fig, ax = plt.subplots()
    ax.plot(wave, yfluxed, label='flux calibrated galaxy spectrum')
    ax.set_xlabel('wavelength (Angstrom)')
    ax.set_ylabel(r'$F_\lambda$ (W m$^{-2} \mu\rm{m}^{-1})$', color='C0')
    ax.set_title('NGC7798 (grism ' + grism + ')')
    yarcturus = funinterp_arcturus(wave)
    ax.plot(wave, yarcturus*factor*1e-7, color='k', label='scaled Arcturus spectrum')
    ax.set_xlim([wvmin, wvmax])
    ax.set_ylim([0, ylim*1e-14])
    ax.legend(loc=3)


# save calibrated galaxy spectra
hdu_sp = fits.PrimaryHDU(data=yfluxedJ, header=image_headerJ)
hdu_sp.writeto('grismJ_flux_ngc7798.fits', overwrite=True)

hdu_sp = fits.PrimaryHDU(data=yfluxedH, header=image_headerH)
hdu_sp.writeto('grismH_flux_ngc7798.fits', overwrite=True)

hdu_sp = fits.PrimaryHDU(data=yfluxedK, header=image_headerK)
hdu_sp.writeto('grismK_flux_ngc7798.fits', overwrite=True)
# generate averaged sky spectrum
with fits.open('obsid_0001005178_results/reduced_mos.fits', mode='readonly') as hdulist:
    sky_headerJ = hdulist[0].header
    sky_dataJ = hdulist[0].data
sp_skyJ = np.sum(sky_dataJ[750:1250,], axis=0)
hdu_sp = fits.PrimaryHDU(data=sp_skyJ, header=sky_headerJ)
hdu_sp.writeto('grismJ_sky_ngc7798.fits', overwrite=True)

with fits.open('obsid_0001005211_results/reduced_mos.fits', mode='readonly') as hdulist:
    sky_headerH = hdulist[0].header
    sky_dataH = hdulist[0].data
sp_skyH = np.sum(sky_dataH[750:1250,], axis=0)
hdu_sp = fits.PrimaryHDU(data=sp_skyH, header=sky_headerH)
hdu_sp.writeto('grismH_sky_ngc7798.fits', overwrite=True)

with fits.open('obsid_0001005222_results/reduced_mos.fits', mode='readonly') as hdulist:
    sky_headerK = hdulist[0].header
    sky_dataK = hdulist[0].data
sp_skyK = np.sum(sky_dataK[750:1250,], axis=0)
hdu_sp = fits.PrimaryHDU(data=sp_skyK, header=sky_headerK)
hdu_sp.writeto('grismK_sky_ngc7798.fits', overwrite=True)
# define auxiliary functions
def read_spectrum(infile):
    hdulist = fits.open(infile)
    image_header = hdulist[0].header
    spectrum = hdulist[0].data
    hdulist.close()
    naxis1 = image_header['naxis1']
    crpix1 = image_header['crpix1']
    if crpix1 != 1.0:
        raise ValueError("Unexpected CRPIX1 != 1.0")
    crval1 = image_header['crval1']
    cdelt1 = image_header['cdelt1']

    xchannel = np.linspace(1, naxis1, naxis1)
    xsp = crval1 + (xchannel - crpix1) * cdelt1
    if spectrum.ndim == 1:
        ysp = np.copy(spectrum)
    elif spectrum.ndim == 2:
        ysp = spectrum[0,:]
    else:
        raise ValueError("Unexpected spectrum.ndim=" +
                         str(spectrum.ndim))
    return xsp, ysp

def plot_feature(ax, z, wavelength, emission, label, flux, offset):
    x = wavelength*(1+z)
    xlab = (wavelength+offset)*(1+z)
    y = flux * 10**(-14)
    dy = 0.1 * 10**(-14)
    if emission:
        ax.plot([x,x],[y, y+dy], 'k-')
        ax.text(xlab, y+1.5*dy, label, fontsize=13,
                horizontalalignment='center', color='black')
    else:
        ax.plot([x,x],[y, y-dy], 'k-')
        ax.text(xlab, y-2.5*dy, label, fontsize=13,
                horizontalalignment='center', color='black')
from scipy.ndimage import gaussian_filter

ymax = 3.5*10**(-14)

# read telluric transmission
telluric_tabulated = np.genfromtxt("skycalc_transmission_R20000.txt")
xtelluric = telluric_tabulated[:,0] * 10  # convert from nm to Angstrom
ytelluric = telluric_tabulated[:,1] * 0.985 * ymax
from matplotlib.backends.backend_pdf import PdfPages
with PdfPages('plot_JHK_ngc7798.pdf') as pdf:
    fig = plt.figure(figsize=(12.5,7.5))  # (10,6)
    plt.rc('text', usetex=True)
    plt.rc('font', family='serif', size=12)

    ax = fig.add_subplot(111)
    ax.set_xlim([11000, 24000])
    ax.set_ylim([0, ymax])
    ax.set_xlabel(r'wavelength (\AA)')
    ax.set_ylabel(r'$F_\lambda$ (W m$^{-2}$ $\mu$m$^{-1}$)')
    # telluric absorptions
    ax.plot(xtelluric, ytelluric, '-', color='darkgrey',
            label="atmosphere transmission")

    # J, H and K spectra
    for igrism, grism in enumerate(['J', 'H', 'K']):
        # sky spectrum
        skyfile = "grism" + grism + "_sky_ngc7798.fits"
        xsky, ysky = read_spectrum(skyfile)
        ysky *= 1.5*10**(-21)
        if igrism == 0:
            ax.plot(xsky, ysky, '-', color='darkgreen',
                    label="sky spectrum (arbitrary units)")
        else:
            ax.plot(xsky, ysky, '-', color='darkgreen')
        # galaxy spectrum
        spfile = "grism" + grism + "_flux_ngc7798.fits"
        xsp, ysp = read_spectrum(spfile)
        if igrism == 0:
            ax.plot(xsp, ysp, '-', color='lightblue',
                    label="galaxy spectrum")
        else:
            ax.plot(xsp, ysp, '-', color='lightblue')
        # smoothed galaxy spectrum
        yfilt = gaussian_filter(ysp, sigma=3)
        if igrism == 0:
            ax.plot(xsp, yfilt, '-', color='red', linewidth=1,
                    label="smoothed galaxy spectrum")
        else:
            ax.plot(xsp, yfilt, '-', color='red', linewidth=1)

    # labels
    ax.set_title(r'NGC7798 (inner $\sim 3$ arcsec)')
    ax.text(12500, 0.9*ymax, 'grism J', fontsize=20,
            horizontalalignment='center', color='orangered')
    ax.text(16400, 0.9*ymax, 'grism H', fontsize=20,
            horizontalalignment='center', color='orangered')
    ax.text(22200, 0.9*ymax, 'grism K', fontsize=20,
            horizontalalignment='center', color='orangered')
    # galaxy redshift
    z = 0.008202
    # emission lines
    plot_feature(ax, z, 12568, True, r'[Fe \sc{ii}]', 2.4, -200)
    plot_feature(ax, z, 12818, True, r'Pa$\beta$', 2.6, 200)
    plot_feature(ax, z, 16346, True, r'[Fe \sc{ii}]', 1.7, 0)
    plot_feature(ax, z, 20520, True, r'He \sc{i}', 1.0, 0)
    plot_feature(ax, z, 21212, True, r'H$_2$', 0.90, 0)
    plot_feature(ax, z, 21654, True, r'Br$\gamma$', 0.88, 0)
    # absorption features
    plot_feature(ax, z, 12112, False, r'Si\sc{i}', 1.6, 0)
    plot_feature(ax, z, 15771, False, r'Mg\sc{i}', 1.20, -200)
    plot_feature(ax, z, 15894, False, r'Si\sc{i}', 1.25, 150)
    plot_feature(ax, z, 16175, False, r'CO', 0.9, 0)
    plot_feature(ax, z, 22063, False, r'Na\sc{i}', 0.40, 0)
    plot_feature(ax, z, 22655, False, r'Ca\sc{i}', 0.55, 0)
    plot_feature(ax, z, 22980, False, r'CO$_1$', 0.4, 0)
    plot_feature(ax, z, 23255, False, r'CO$_2$', 0.25, 0)
    plot_feature(ax, z, 23545, False, r'CO$_3$', 0.35, 0)
    # legend
    box = ax.get_position()
    ax.set_position([box.x0, box.y0, box.width, box.height*0.90])
    leg = ax.legend(loc=3, bbox_to_anchor=(0., 1.08, 1., 0.07),
                    mode="expand", borderaxespad=0., ncol=2,
                    numpoints=1)
    # increase width of legend lines
    for legobj in leg.legendHandles:
        legobj.set_linewidth(2.0)

    pdf.savefig()
    plt.close()