Analyzing Spectra with DSLR cameras
Contents
Analyzing Spectra with DSLR cameras#
Motivation#
Illumination engineers use spectrophotometers to determine the nature of the lamps used in public illumination or other sources of light. These devices provide, besides the spectrum of the lamp, some useful parameters as the brightness, CRI etc. The instruments are expensive for a casual user as a citizen interested in determine the color temperature of a LED lamp.
While the method of StreetSpectra is enough to determine the nature of the lamps technology (Fluorescent, High Pressure Sodium, LED, etc) it is difficult to distinguish among the color temperature of the LEDs.
Note
Browse the StreetSpectra manual
The main idea is to calibrate a digital camera (DSLR or phone camera) to extract the spectrum from an observation taken with the camera fited with a transmission grating.
Spectral calibration of a color digital camera#
Color digital cameras have pixels that are sensitive to Blue, Red and Green photons. They are distributed in a pattern: the Bayer matrix in which the G channel is repeated. The calibration of DSLR to determine the spectral response is usually performed with a optics workbench. The sensitivity curve represent the response of the system (sensor and optics) to different color of the light. The light from a monochromator is fed to the camera that record images with different wavelengths.
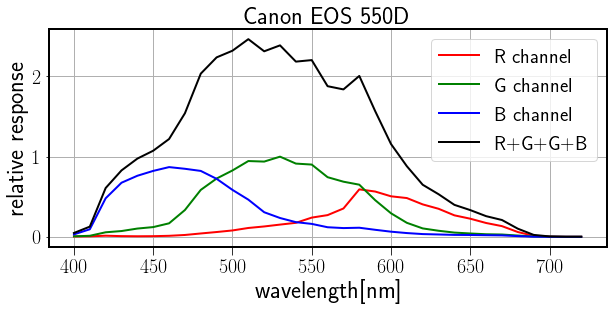
Fig. 80 Spectral response of a Canon EOS 550D obtained with a workbench with monochromator. (c) Jiang et al. (2013)#
The graph in Fig. 80 represents the response to the three different channels of the Canon EOS550D camera. The ‘total’ response labelled as R+G+G+B is the sum of the response of all the channels.
Digital camera as a spectrometer#
Using a transmission grating at the lens entrance of a camera we can record the light source and its spectrum. The length of the spectrum and its brightness depends in the camera settings (focal distance of the lens, diafragm, exposure, ISO etc) and the distance to the lamp. After some tries it is easy to find the appropriate settings to record both the source and the spectrum in the same frame.

Fig. 81 Simple setup of camera (Canon EOS550D) fitted with a transmission difraction grating Spectral to picture spectra of lamps (left) and smartphone and some gratings (right).#
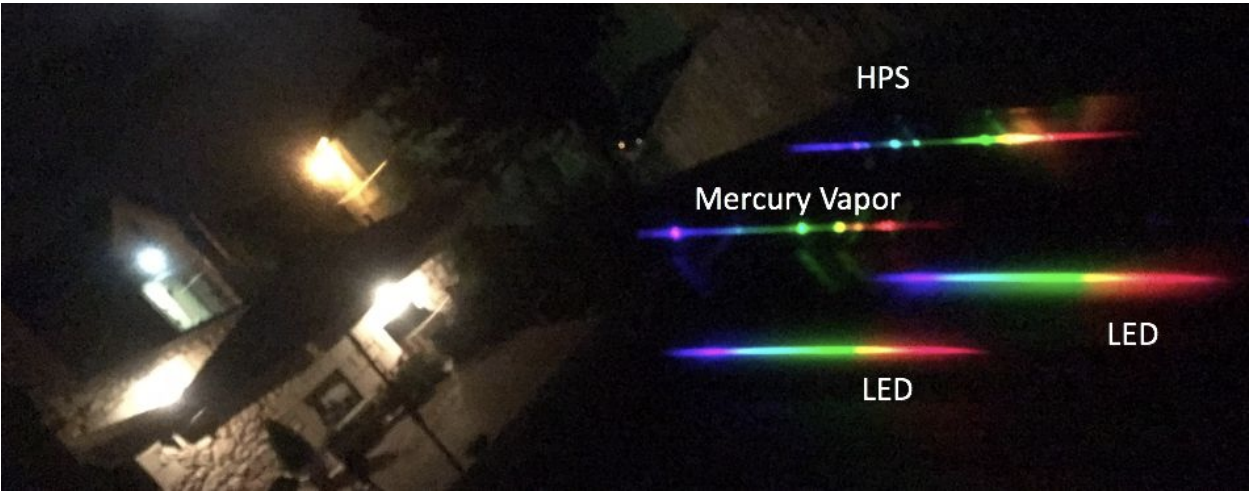
Fig. 82 Picture of lamps and their spectra taken at night in a location with mixed illumination luminaries.#
Extraction of the region of interest#
There are regions of the picture without scientific interest. It is useful to clip the picture to frame the lamp and the spectrum.
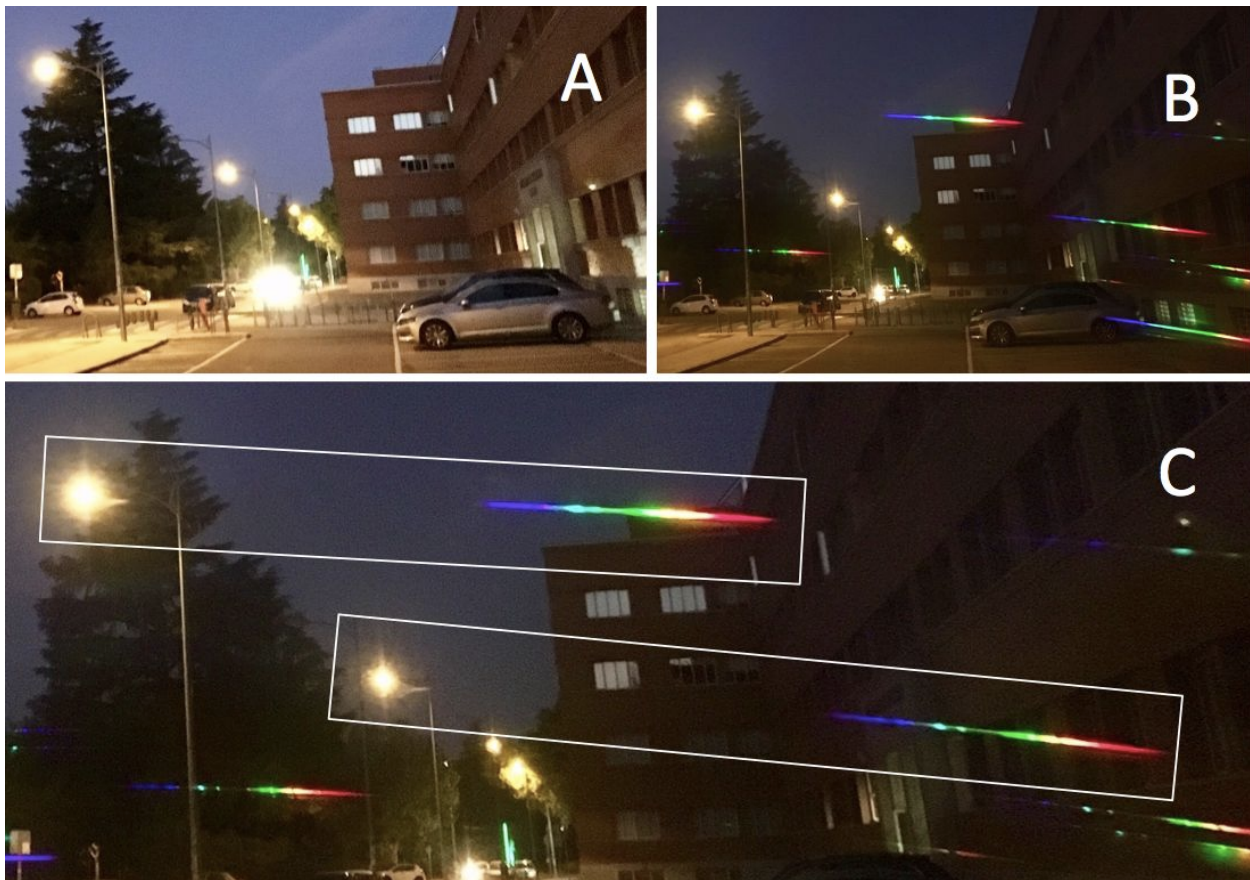
Fig. 83 Spectra of HPS lamps obtained with a transmission grating and recorded with a smartphone. (A) Direct picture obtained with the phone. (B) Picture taken at the same place after placing a grating over the camera lens. (C) Detail of two of the lamps with their corresponding spectrum.#
Calibration of the spectrometer#
Setup#
We can calibrate or camera plus grating system by recording the spectrum of a known lamp source used as calibrator source. The observed spectrum is compared with the database spectrum to determine the spectral response.
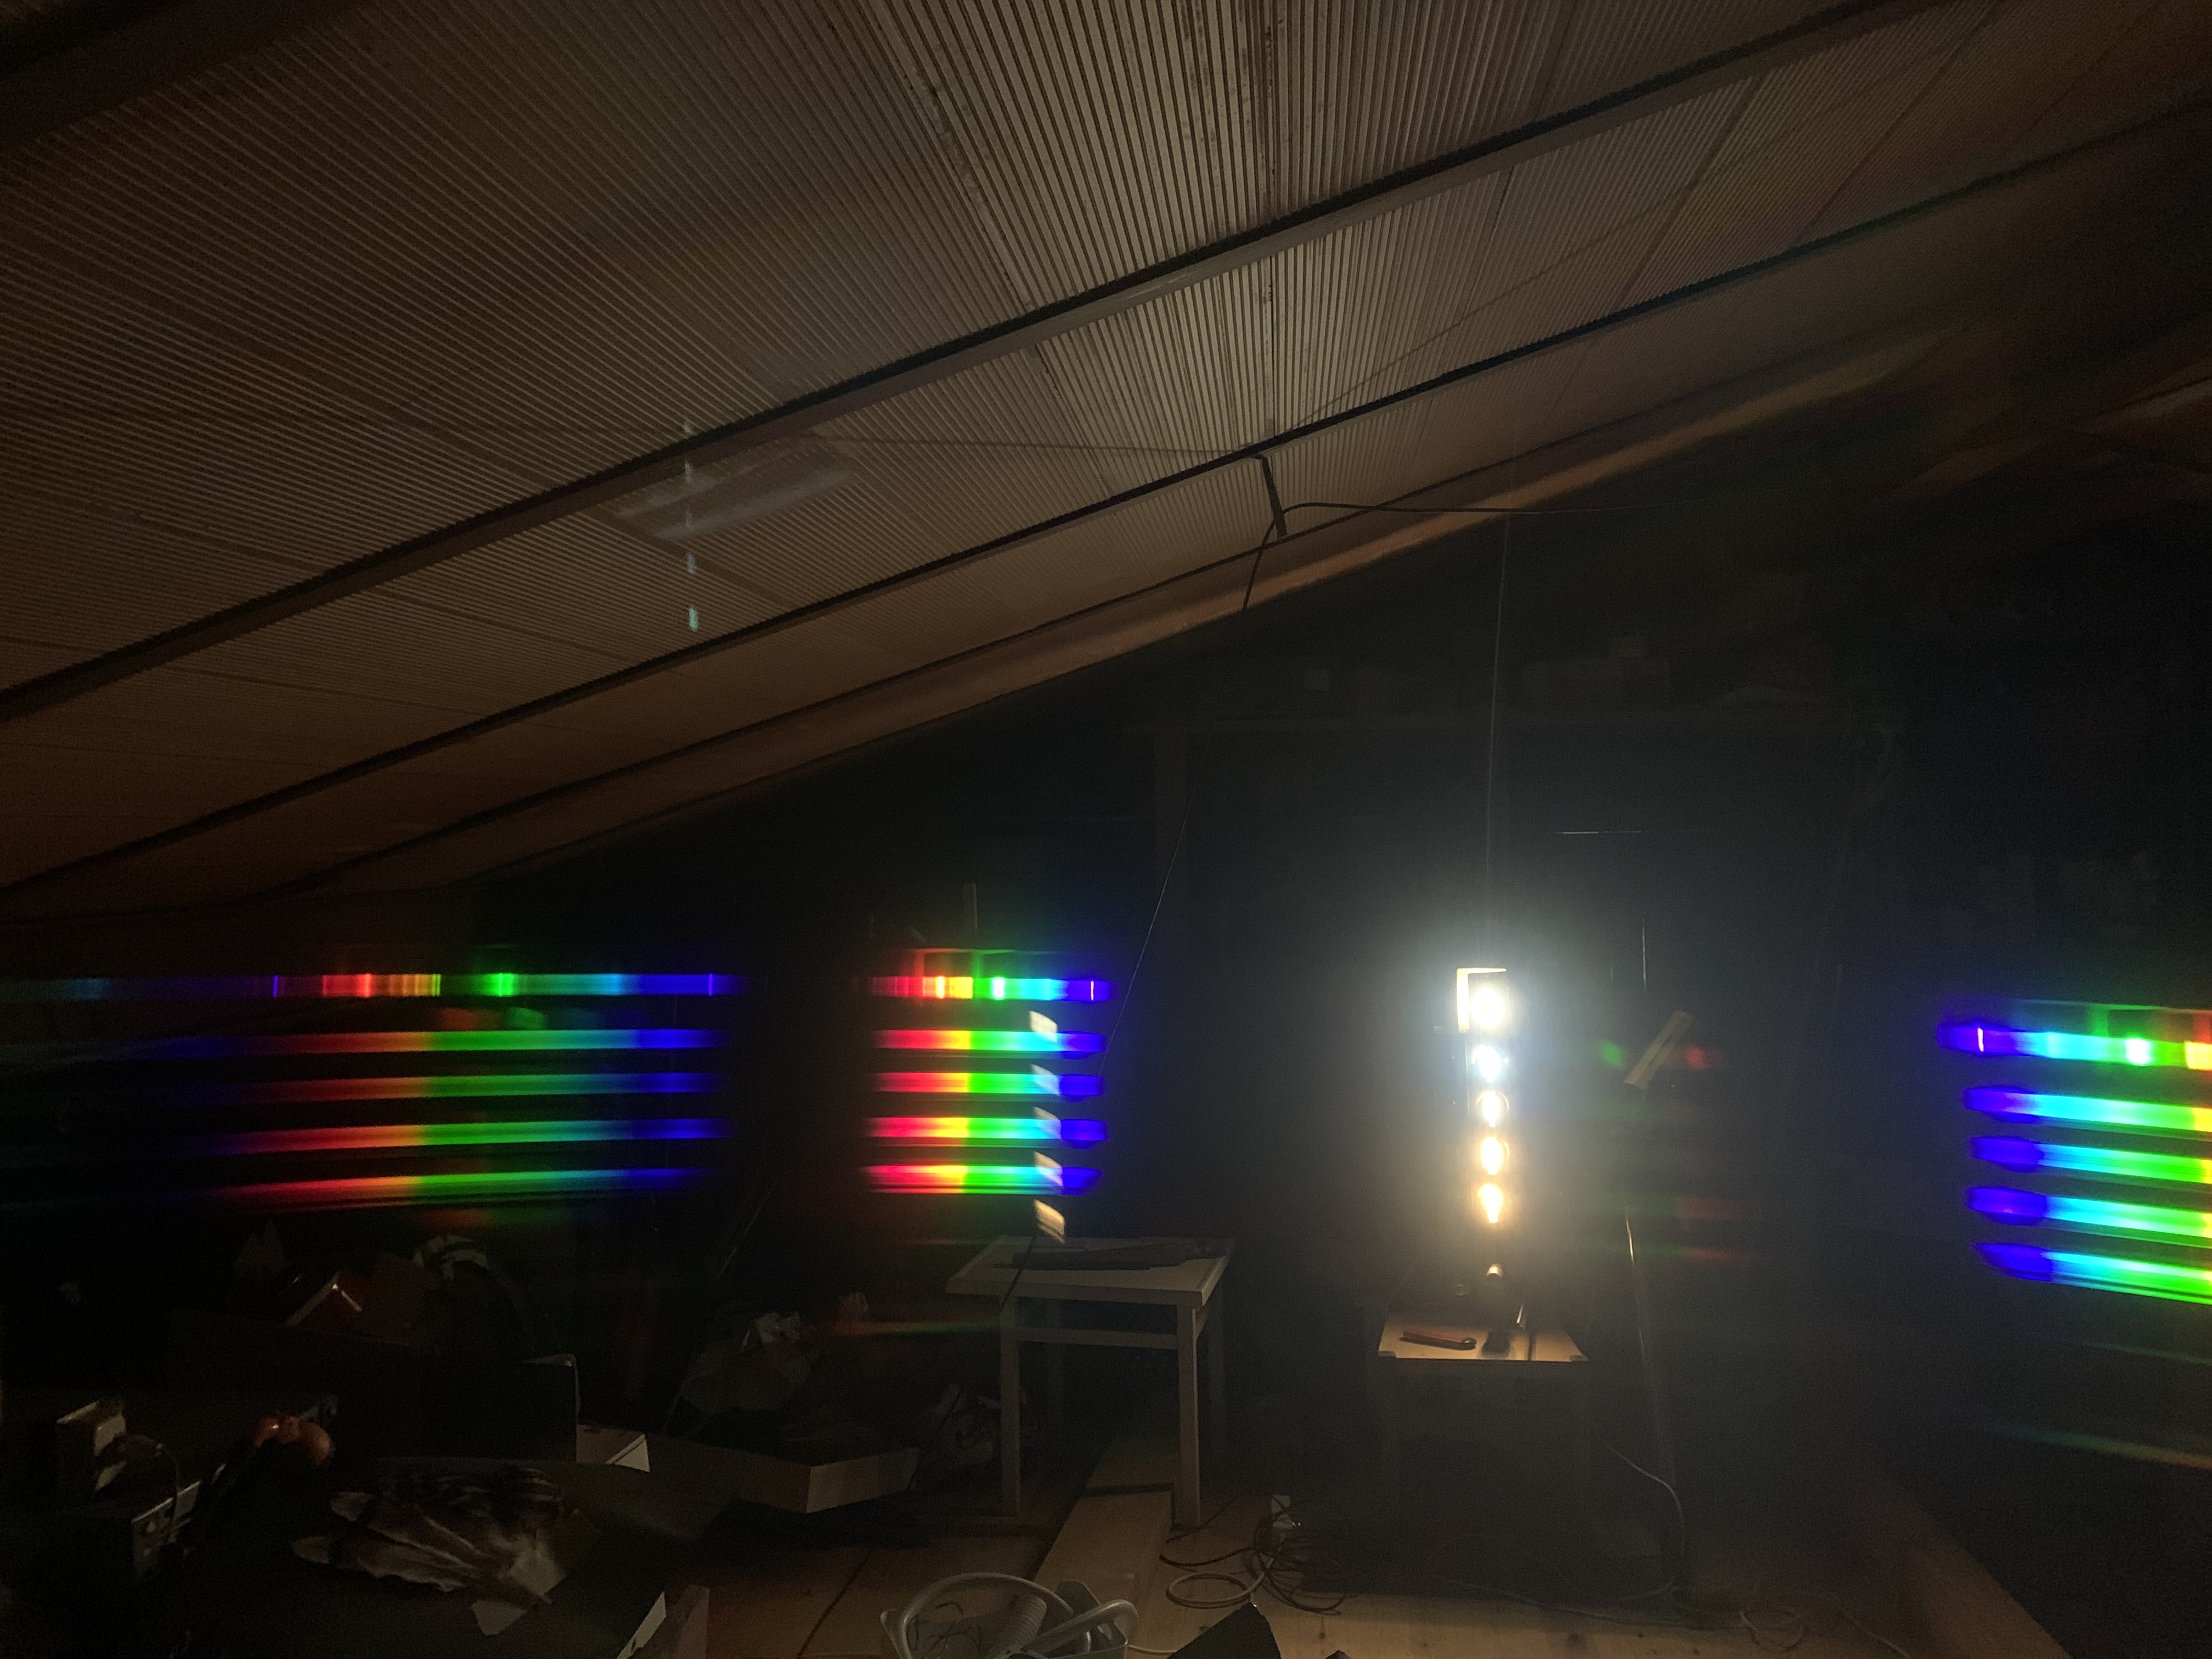
Fig. 84 Picture obtained with a Canon EOS 550D with a transmission grating. The lights are LEDs of different color temperature and a Compact Fluorescent Lamp for wavelenght calibration.#
The Fig. 84 shows a setup used for calibration. Several lamps (bright spots of different colors) have been placed in a vertical line. The transmission grating was rotated to show the spectra in horizontal. The spectral orders m=1 and m=2 are visible at the left while the beginning of the m=-1 order appear at the right.
Monodimensional spectrum#
The pictures taken in RAW mode are digital imeges whose pixel values are proportional to the light received. We can read the files and extract the useful region.
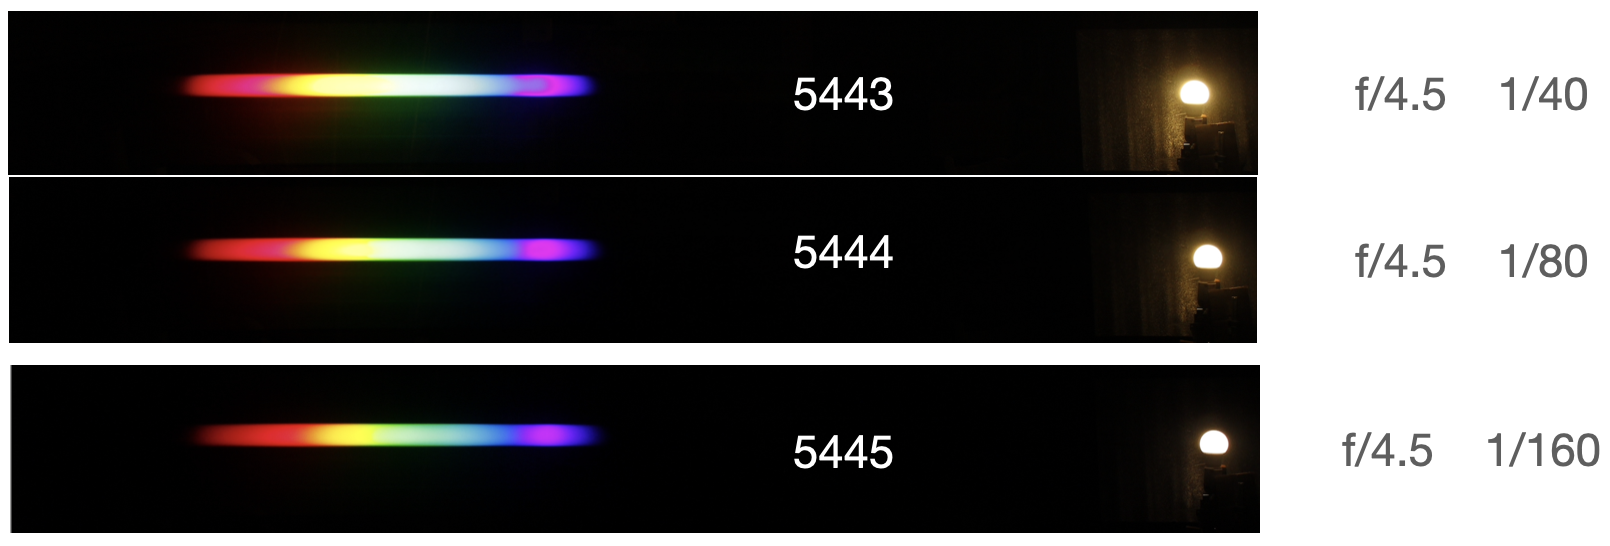
Fig. 85 Showing the clips framing the spectra of a LED2700K from Ikea observed with different exposure times. White labels refers to the picture number.#
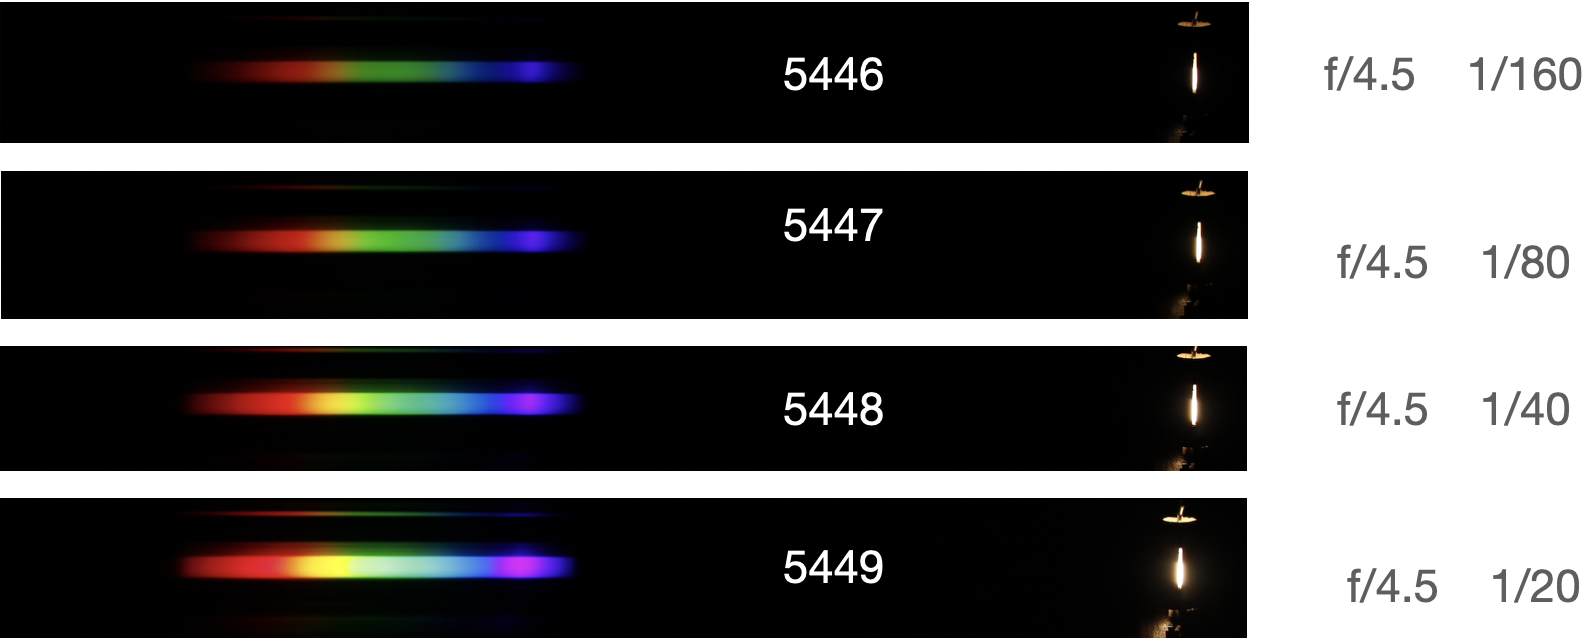
Fig. 86 Same as Fig. 85 but using a slit to convert the lamp in a narrow source of light.#
Some test with a Canon EOS 550D and an Ikea 2700K lamp are shown at Fig. 85 and Fig. 86 . Several pictures were taken to find the appropriate exposure.
The spectrum image can be converted to monodimensional by summing up the lines with signal. An additional step is necessary to align the spectrum when not completelly aligned in horizontal.

Fig. 87 Bidimensional spectrum of Ikea LED2700K (top) and two spectra of a Compact Fluorescent Lamp (CFL) with different exposure times. The images have been flipped so the red part of the spectrum is located on the right in the conventional way.#
In Fig. 87 all the color pixels has been added and the results is equivalent to use a monochrome camera.
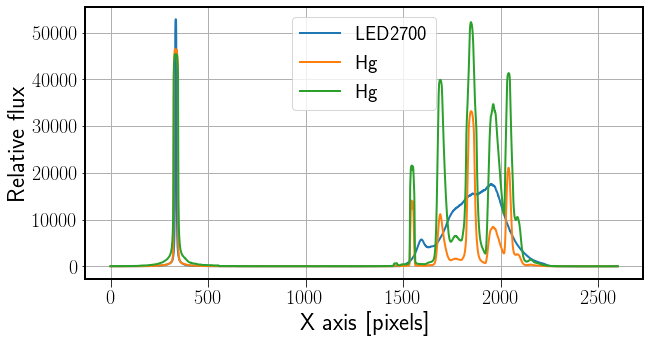
Fig. 88 Monodimensional spectrum of the spectra in Fig. 87.#
Wavelength calibration#
The monodimensional spectra in Fig. 88 are not calibrated in wavelength. The x-axis represent positiom on the original image, i.e. the units are pixel number. To perform the wavelength calibration we need to compara position (pixels) with wavelength using the information provided by the spectral lines that are present in the CFL spectrum. Most of the peaks corresponds to well known lines of Mercury (Hg). Browse, for instance, the plots at https://en.wikipedia.org/wiki/Fluorescent_lamp
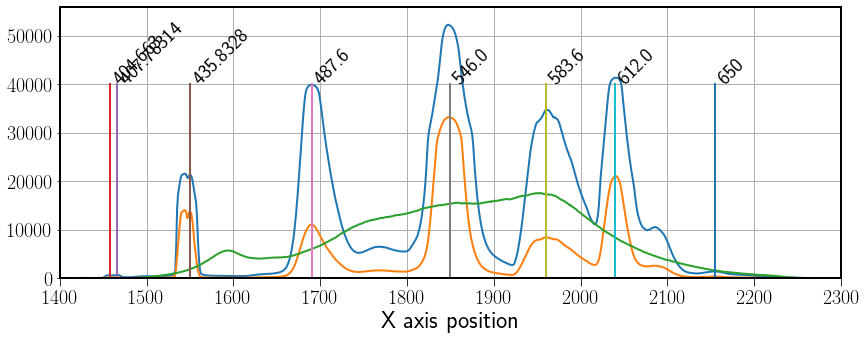
Fig. 89 Monodimensional spectrum of CFL with annotated identified spectral lines. The peaks at left correspond to the direct image of the lamps. The spectra begin around pixel 1400.#
The identified lines are labelled at Fig. 89 . After a linear (or polynomial of 3rd degree) fit position versus wavelength we an convert pixel number to wavelength in nanometers. The transformation obtained with the CFL spectrum is valid for the LED spectrum as the setup was made carefully to align both spectra.
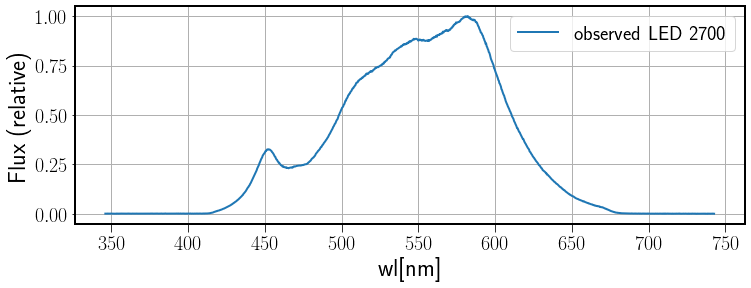
Fig. 90 Monodimensional spectrum of the LED 2700K calibrated in wavelength.#
Response curve#
The actual spectrum of the Ikea LED2700 lamp can be found at the LICA database of lamps spectra.
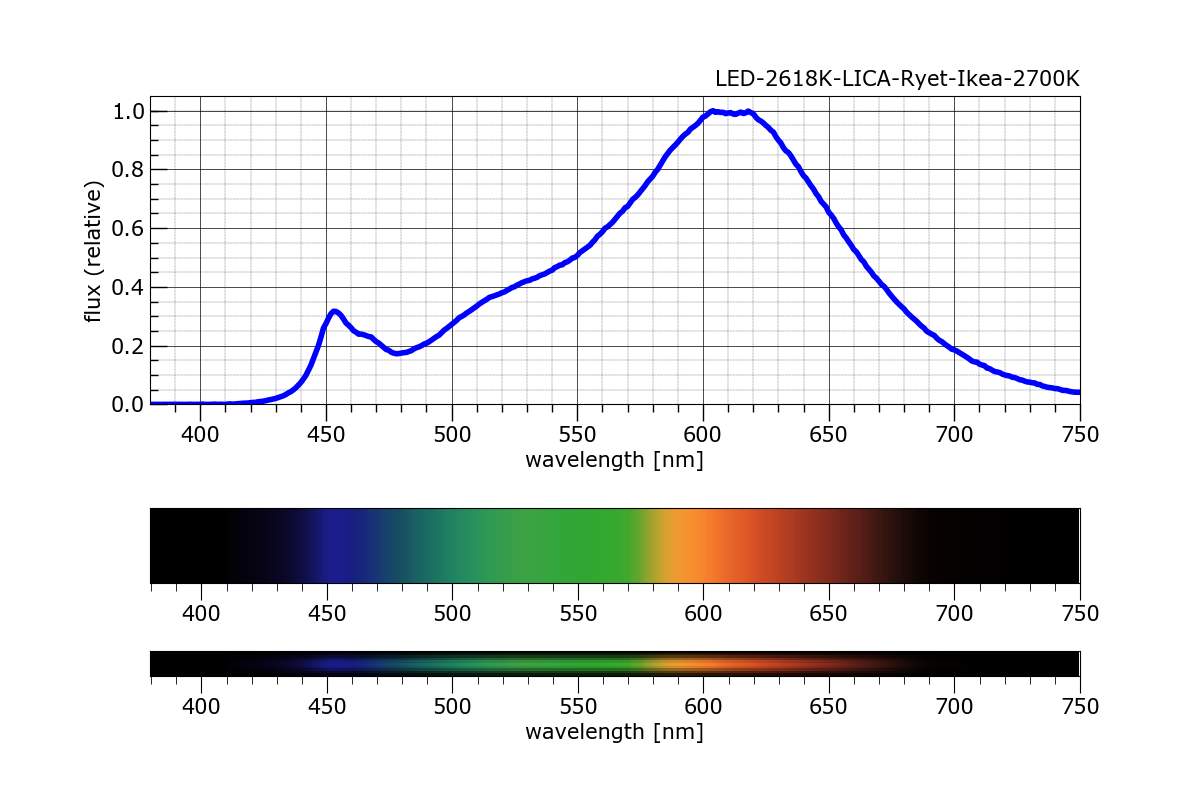
Fig. 91 Plot of the Ikea LED 2700K obtained from the UCM-LICA database of lamps. https://guaix.fis.ucm.es/lamps_spectra.#
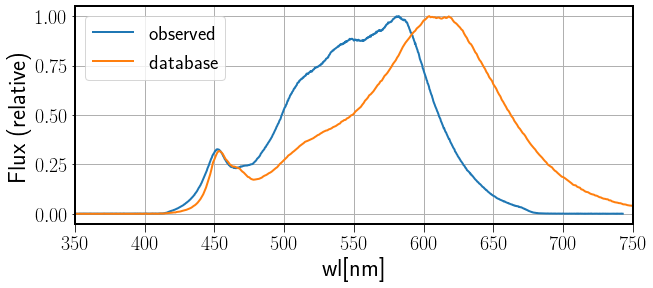
Fig. 92 Monodimensional spectrum of the LED 2700K calibrated in wavelength and the observed spectrum of the same lamp model.#
The comparison of the observed and the database spectrum is shown in Fig. 92 . The response of the camera drops in the red part of the spectrum around 600nm.
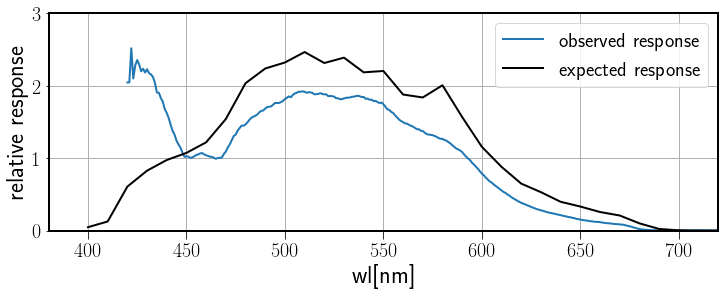
Fig. 93 Observed and expected response using a LED 2700K.#
Fig. 93 is the rsult of the division of the observed spectrum and the spectrum obtained from the database. The spectral response in the blue region of the spectrum is very bad determined due in part to the drop in sensitivity. One problem is the lack of signal in the nlue for the LED used for calibration whose color temperature is very low.
