Photometry with DSLR cameras
Contents
Photometry with DSLR cameras#
Scientific use of DSLRs#
Digital Single Lens Reflex (DSLRs) are consumer grade digital cameras whose detector is a CMOS (Complementary metal–oxide–semiconductor). They can be used to image astronomical fields using their own lenses or a telescope.
The optical image is converted to a digital file representing a matrix of pixels with values proportional to the amount of light received. This linearity between digital counts or ADUs (analog to digital units) is valid when the camera is used in the RAW mode and the values delivered have not been transformed to a JPEG representation as is usual in common day photography.
Being the unprocessed data from the CMOS image sensor (native RAW mode) proportional to the light received in each pixel the observations can be used to derive photometric results (physical units) when the system (camera & optics) is calibrated.
Bayer matrix#
The DSLR image sensor is a matrix of photosensor called pixels. Each pixel responds to light in one of the three photometric bands R, G and B depending on the color filter over the pixel. The distribution of the filters in the matrix is arranged with a color filter array (CFA). This mosaic is called the Bayer matrix (for Bryce Bayer its inventor) and allows to derive color images from a single observation by combining the signal from the blue, green and red pixels. Examples of the CFA pattern are for instance RGGB or BGGR meaning that the pixel are arranged as the Fig. 1 shows.
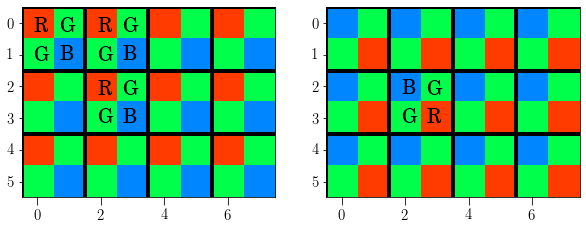
Fig. 1 Example of two CFA patterns (RGGB & BGGR) of the Bayer matrix. Only a part of the sensor is shown.#
The mosaic of color filters in the first example (at left) are arranged as RGGB and distributed in a mosaic repeating this pattern as shown in the left part of Fig. 1.
It shoul be noted that there are 2 green channels and only one of four pixels are blue or red. The Bayer matrix provides a method to obtain color images with a single shot by combining the images created in the blue, red and green pixels. The DSLRs and the cameras of the smartphones use this RGB method to provide a color image.
Note
May be something about human vision
The result of an observation with a sensor with Bayer matrix is in fact four images taken with R, G, G and B filters. These images have a size which is one fourth of the complete RAW image and the final ‘red image’ is composed of one of each fourth pixels in the complete image. It should also be noted that some of the light is lost.
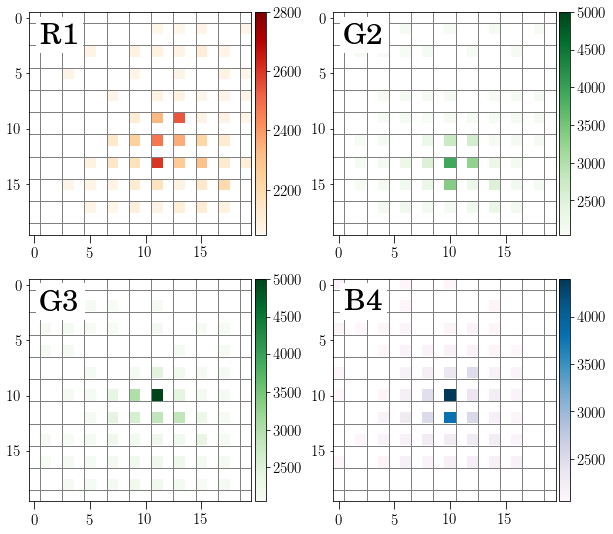
Fig. 2 Clip on a part of a picture with a star. The RAW image is decomposed in the RGGB channels. Note that the sampling of the optical image is not complete in any channel.#
This is not a problem for the everyday pictures but could be a problem for research. For instance, when imaging a star in an astronomical observation, there are ‘green photons’ that impact in ‘blue pixels’ that are not transmited by the blue filter and not counted. The sampling of the focal plane is not complete.
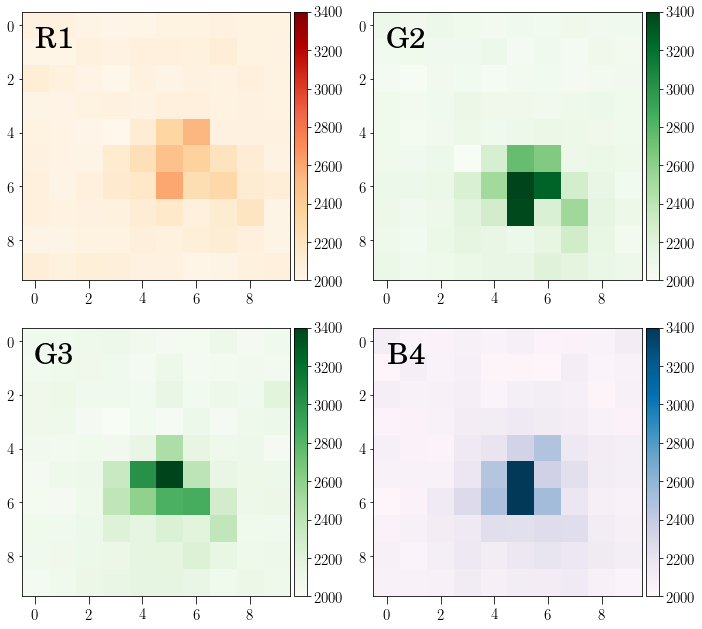
Fig. 3 Same clip centered in the star HR4825 showing the four images extracted from the RAW picture. The lens was defocused to yield smeared images of the stars.#
Point Spread Function#
For an ideal optical system, that has been well focussed, the light of a point like source as a star is distributed in the focal plane as an Airy disk representing the diffraction pattern. In a real observation this diffraction limited image is smeared to a wider image due to effect in the wave front of the light by the turbulence of the atmosphere. Some other effects as poor guiding of the telescope or optical aberrations can contribute to deform the image of the stars. The resulting pattern for a point like source is called the Point Spread Function (PSF).
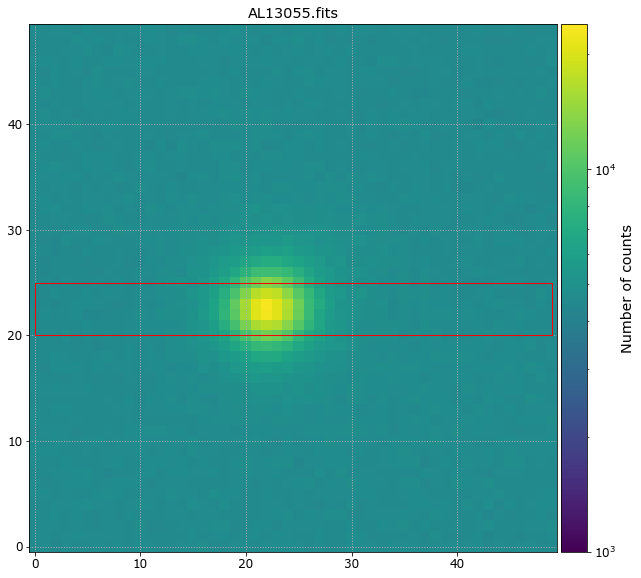
Fig. 4 Image of a star showing the distribution of the light in a several pixels.#
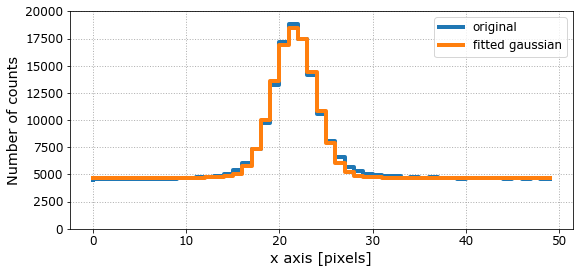
Fig. 5 The distribution of the light along the x-axis is shown by adding the lines between the red lines of Fig. 4. A gaussian function has been fitted.#
The example of Fig. 4 shows a symmetrical PSF obtained with the Jacobus Kapteyn Telescope (JKT) which is a profesional telescope of 1m diameter and f/15 at Observatorio del Roque de los Muchachos. The cut along the x-axis can be fitted by a Gaussian of \(\sigma\) = 2.26 pixels. In this case the size of the pixel was 15µm and the plate scale 0.2138 arcsec/pixel, thus the \(\sigma\) = 0.48 arcsec. The Full Width at Half Maximum FWHM = 0.48 \(\times\) 2.355 = 1.14 arcsec.
In the example of an observation with a DSLR ( Fig. 3 ) the sampling is worse. It is interesting to note that the two green images obtained after demosaicing the RAW image are different.
Photometric systems#
Photometric systems are defined by photometric bands. These bands depends on the filter transmission and on the spectral response of the detectors. More information on the review by Bessel 2005ARA&A..43..293B Standard Photometric Systems by Michael S Bessel.
Photometric systems are defined with observations of a set of stars. The magnitudes and colors (color indexes are magnitude differences in two bands) for a selected list of stars (standard stars) are used as reference. To determine the magnitudes of an astronomical object of our interest we must perform observations of some of these standard stars. See later ‘Photometry methods’.
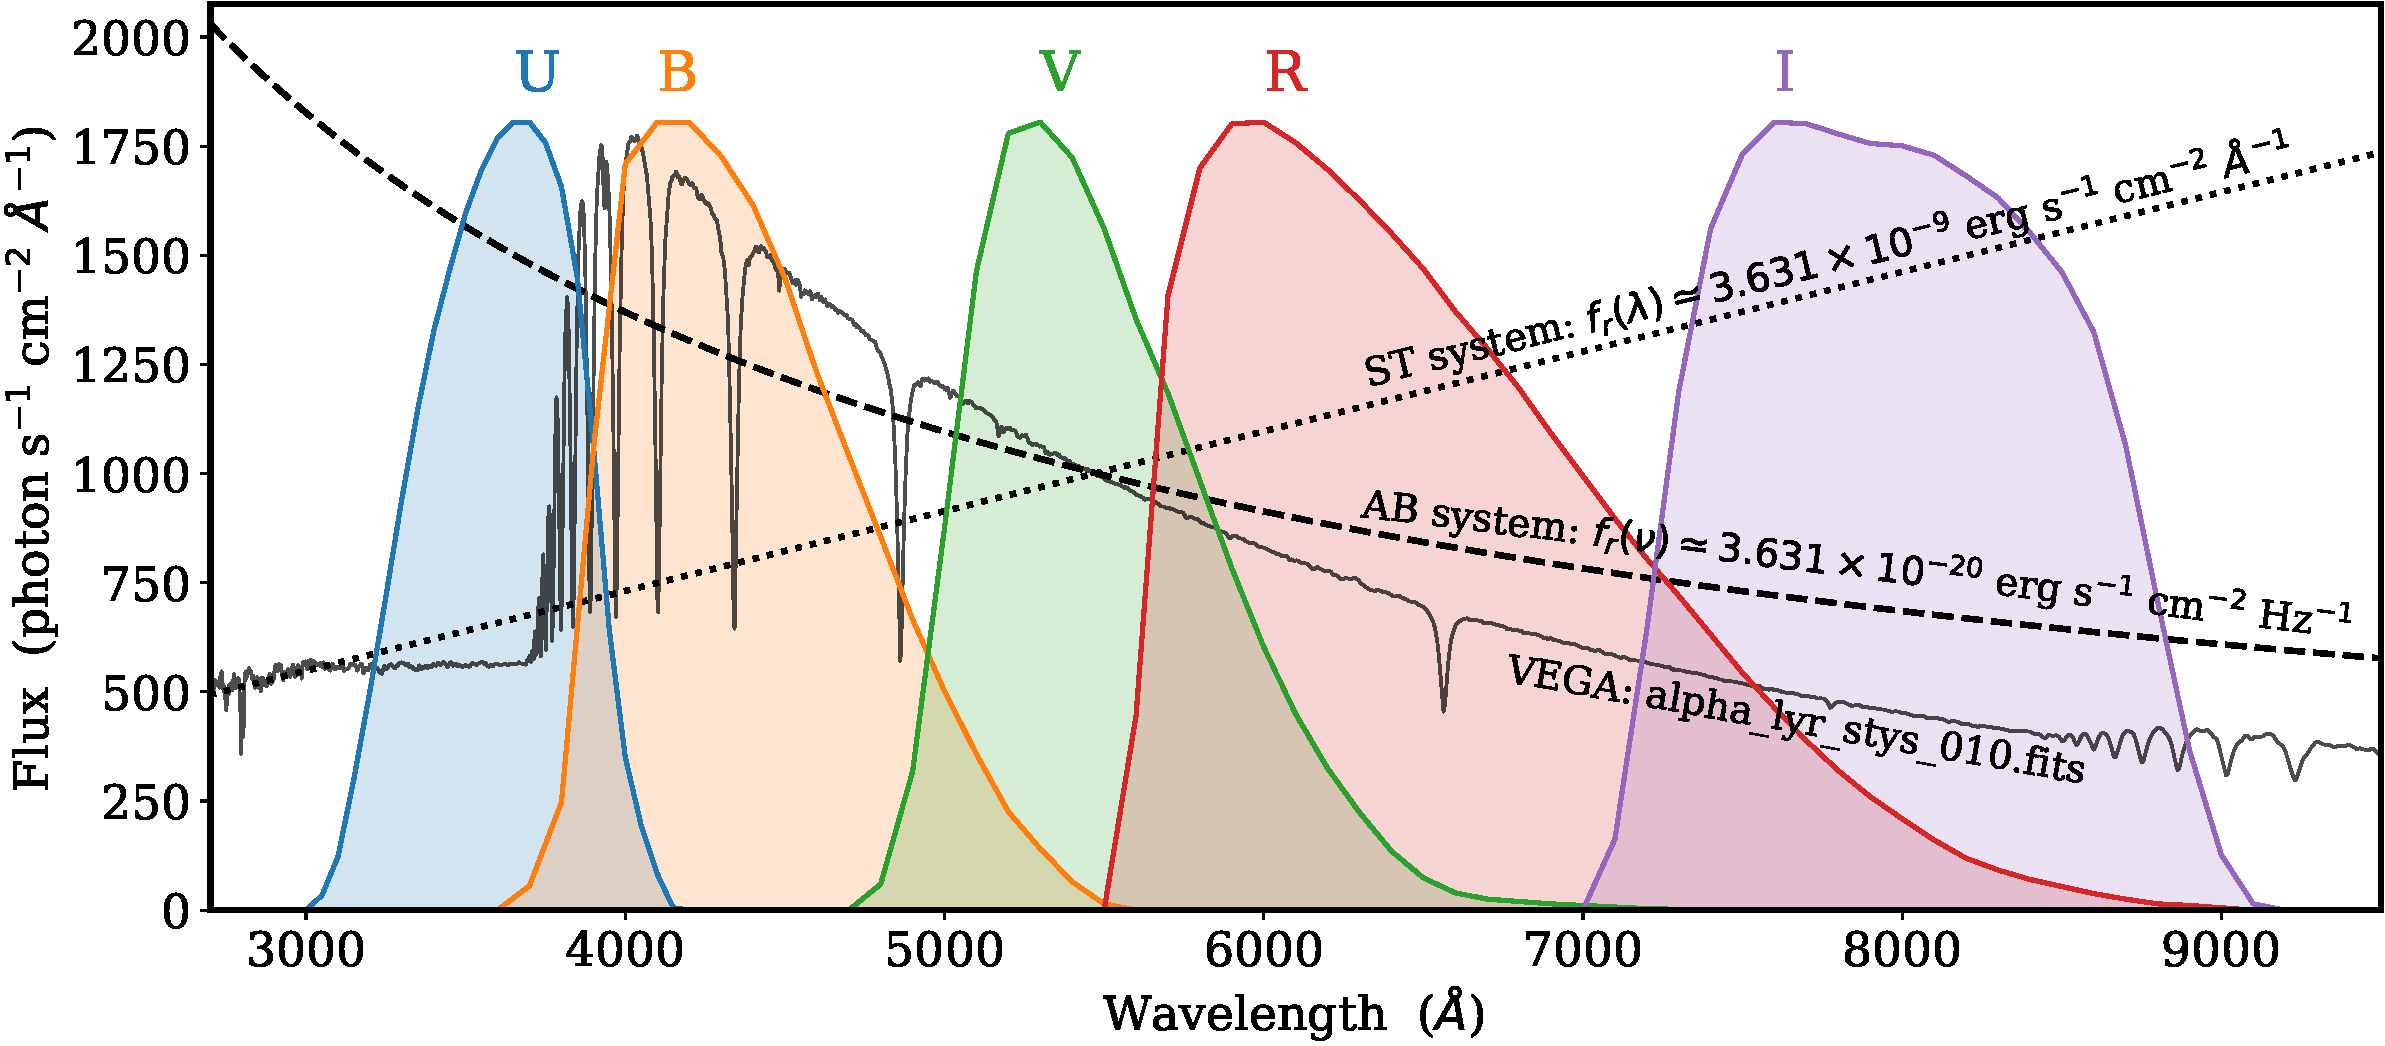
Fig. 6 Johnson-Cousins UBVRI bands and reference spectra used in astronomical photometry (PHOTLAM units).#
Besides the response curve of the bands we need to know the use of units of the spectra i) energy units FLAM \(erg s^{-1} cm^{-2} Å^{-1}\), o FNU \(erg s^{-1} cm^{-2} Hz^{-1}\)), or ii) photons units PHOTLAM \(photon s^{-1} cm^{-2} Å^{-1}\), o PHOTNU \(photon s^{-1} cm^{-2} Hz^{-1}\)). Moreover there are three choices for the reference spectrum to determine the magnitude scale zero point: Vega, AB y ST. The Johnson-Cousins UBVRI system is well known and it is an example of wide band photometry. Fig. 6 shows bands of this photometric system and the reference spectra. The complete explanation is out of the scope of this document.
The magnitude in a photometric band S(λ) of a celestial object with spectrum F(λ) can be determined as,
where \(F_o(\lambda)\) is the spectral distribution of energy of the reference stars used to determine the photometry zero point. For example for the Johnson-Cousins V band the spectrum of Vega (\(\alpha\) Lyrae) was used as reference and it was decided to fix V(Vega) = 0.
where \(𝑐 = 2.99792458 × 10^8 m\;s^{-1}\) is the speed of light in vacuum, \(\lambda\) i wavelength in m and Jy (jansky) is one astronomical unit for spectral irradiance (out of the SI system) Jy = \(10^{-26} W m^{-2} Hz^{-1}\). More information in Bará et al (2020) https://doi.org/10.1093/mnras/staa323.
RGB photometry#
Spectral response of a color camera#
The spectral response is a representation of the the ability of the system to detect photons of different colors. This curve depends on the wavelength of the light. For digital color cameras the response curve of each channel is different, i.e. there are three different curves for R, G and B channels. The calibration of DSLR to determine the spectral response is usually performed with a optics workbench. The light from a monochromator is fed to the camera that record images with different wavelengths.
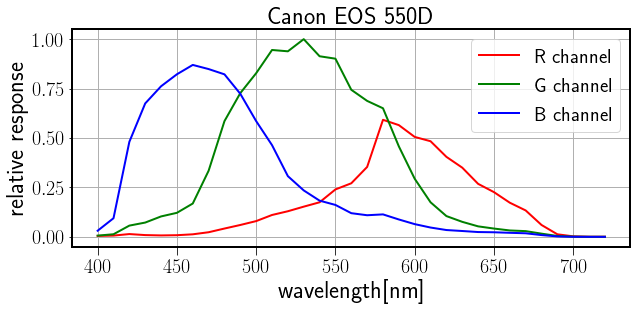
Fig. 7 Spectral response of a Canon EOS 550D camera obtained with a workbench with monochromator. (c) Jiang et al. (2013)#
The response curve or spectral sensitivity for a Canon EOS 550D DSLR is shown in Fig. 7 . More spectral sensitivity data can be found at Camera Spectral Sensitivity Database
Photometry with DSLRs#
The typical photometric astronomical observation use a telescope fitted with a camera that image the star field in the focal plane. Using a panoramic detector as a CCD (Charge Coupled Device) the astronomer obtain successive images in the different bands which are selected by inserting them in the optical train by means of a filter wheel.
All the profesional observatories have a set of the filters needed to observe in the traditional Johnson-Cousins photometric system. The amateur astronomers who wish to observe in this system should acquire the filter set in the first place. They are not cheap and many astronomers are observing with a color filter set RGB and a monochrome camera.
On the other hand when using a digital color camera as a DSLR the bands are defined by the RGB color channels. There is no need of additional filters and one exposure with a color camera provides the observation in three bands.
The American Association of Variable Star Observers AAVSO edited the Digital Single Lens Reflex (DSLR) Camera Observing Manual a guide with tutorials, for observations with DSLR. The reader is referred to this complete manual.
The problem is to transform observations in the RGB bands of your camera to the Johnson-Cousins photometric system. The green G band and the Johnson-Cousins V are similar (read later) and the transformation is easy.
Customer grade DSLRs have similar RGB response curves defined mainly by the sensor used. Fig. 8 shows several curves of different DSLRs.
The RGB photometric system#
An RGB photometric system has been defined to easy the use of color cameras (DSLRs and astronomical monochrome cameras with RGB filter set in a filter wheel) to easy the use of research grade photometry to amateur astronomers. These observers can use their own instrumentation and refer the observation to the standard stars in this system. Defining the system bands as an average of the response of common use DSLRs, the response of their cameras would be similar and the photometric transformation very straightforward.
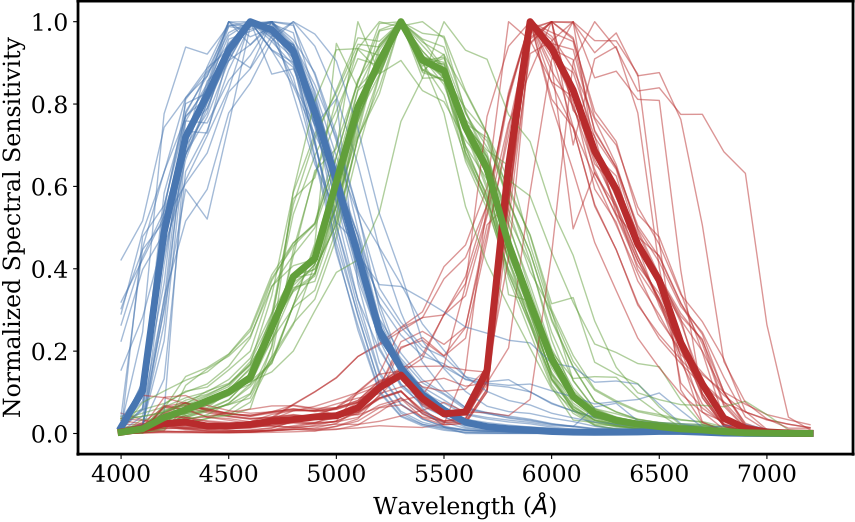
Fig. 8 Spectral response of several DSLRs (c) Jiang et al. (2013) and the average RGB bands.#
More information on the RGB Photometric System can be found at the webpage https://guaix.ucm.es/rgbphot/ and the researcher papers.
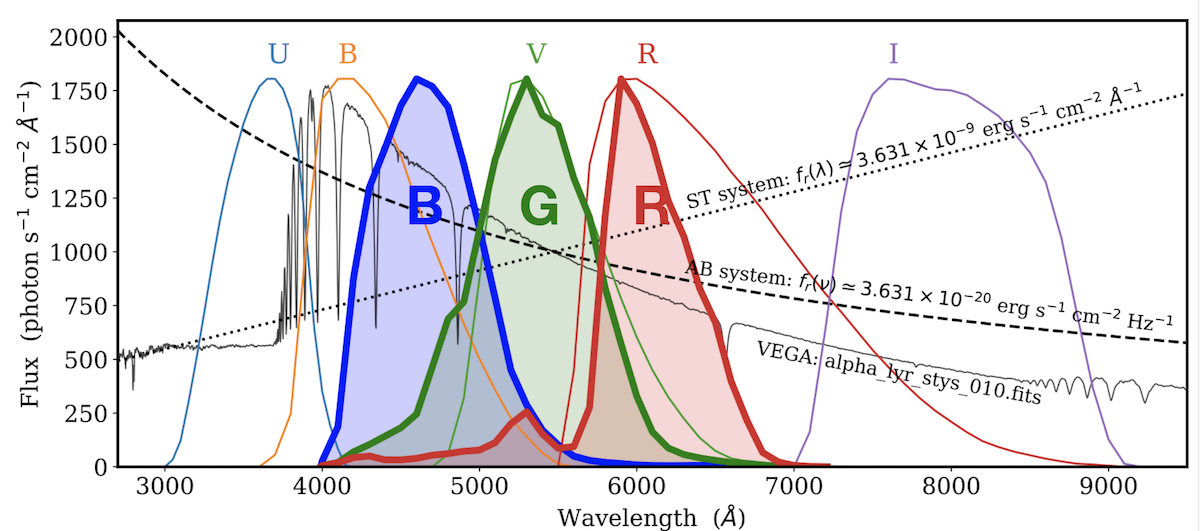
Fig. 9 RGB photometric bands compared with Johnson-Cousins bands.#
It is interesting to note that the RGB and the Johnson B, V and R bands are different (Fig. 68 ). Only the green G band and the Johnson-Cousins V are similar. That explains that it is easy to derive V magnitudes from G band observations.
