Monitoring Light Pollution with DSLR cameras
Contents
Monitoring Light Pollution with DSLR cameras#
Introduction#
This chapter describes the observations to be made with Digital Single Lens Reflex (DSLRs) to determine Light Pollution evolution and it is dedicated to photographers who shot pictures at night and also to citizen interested in measuring the sky brightness from a fixed monitor station.
All-sky pictures#
With a lens with small focal length it is possible to picture the whole sky vault in one shot. The all-sky images obtained with this combination of camera with fisheye lens is useful to map the sky brightness in any direction including the horizon.
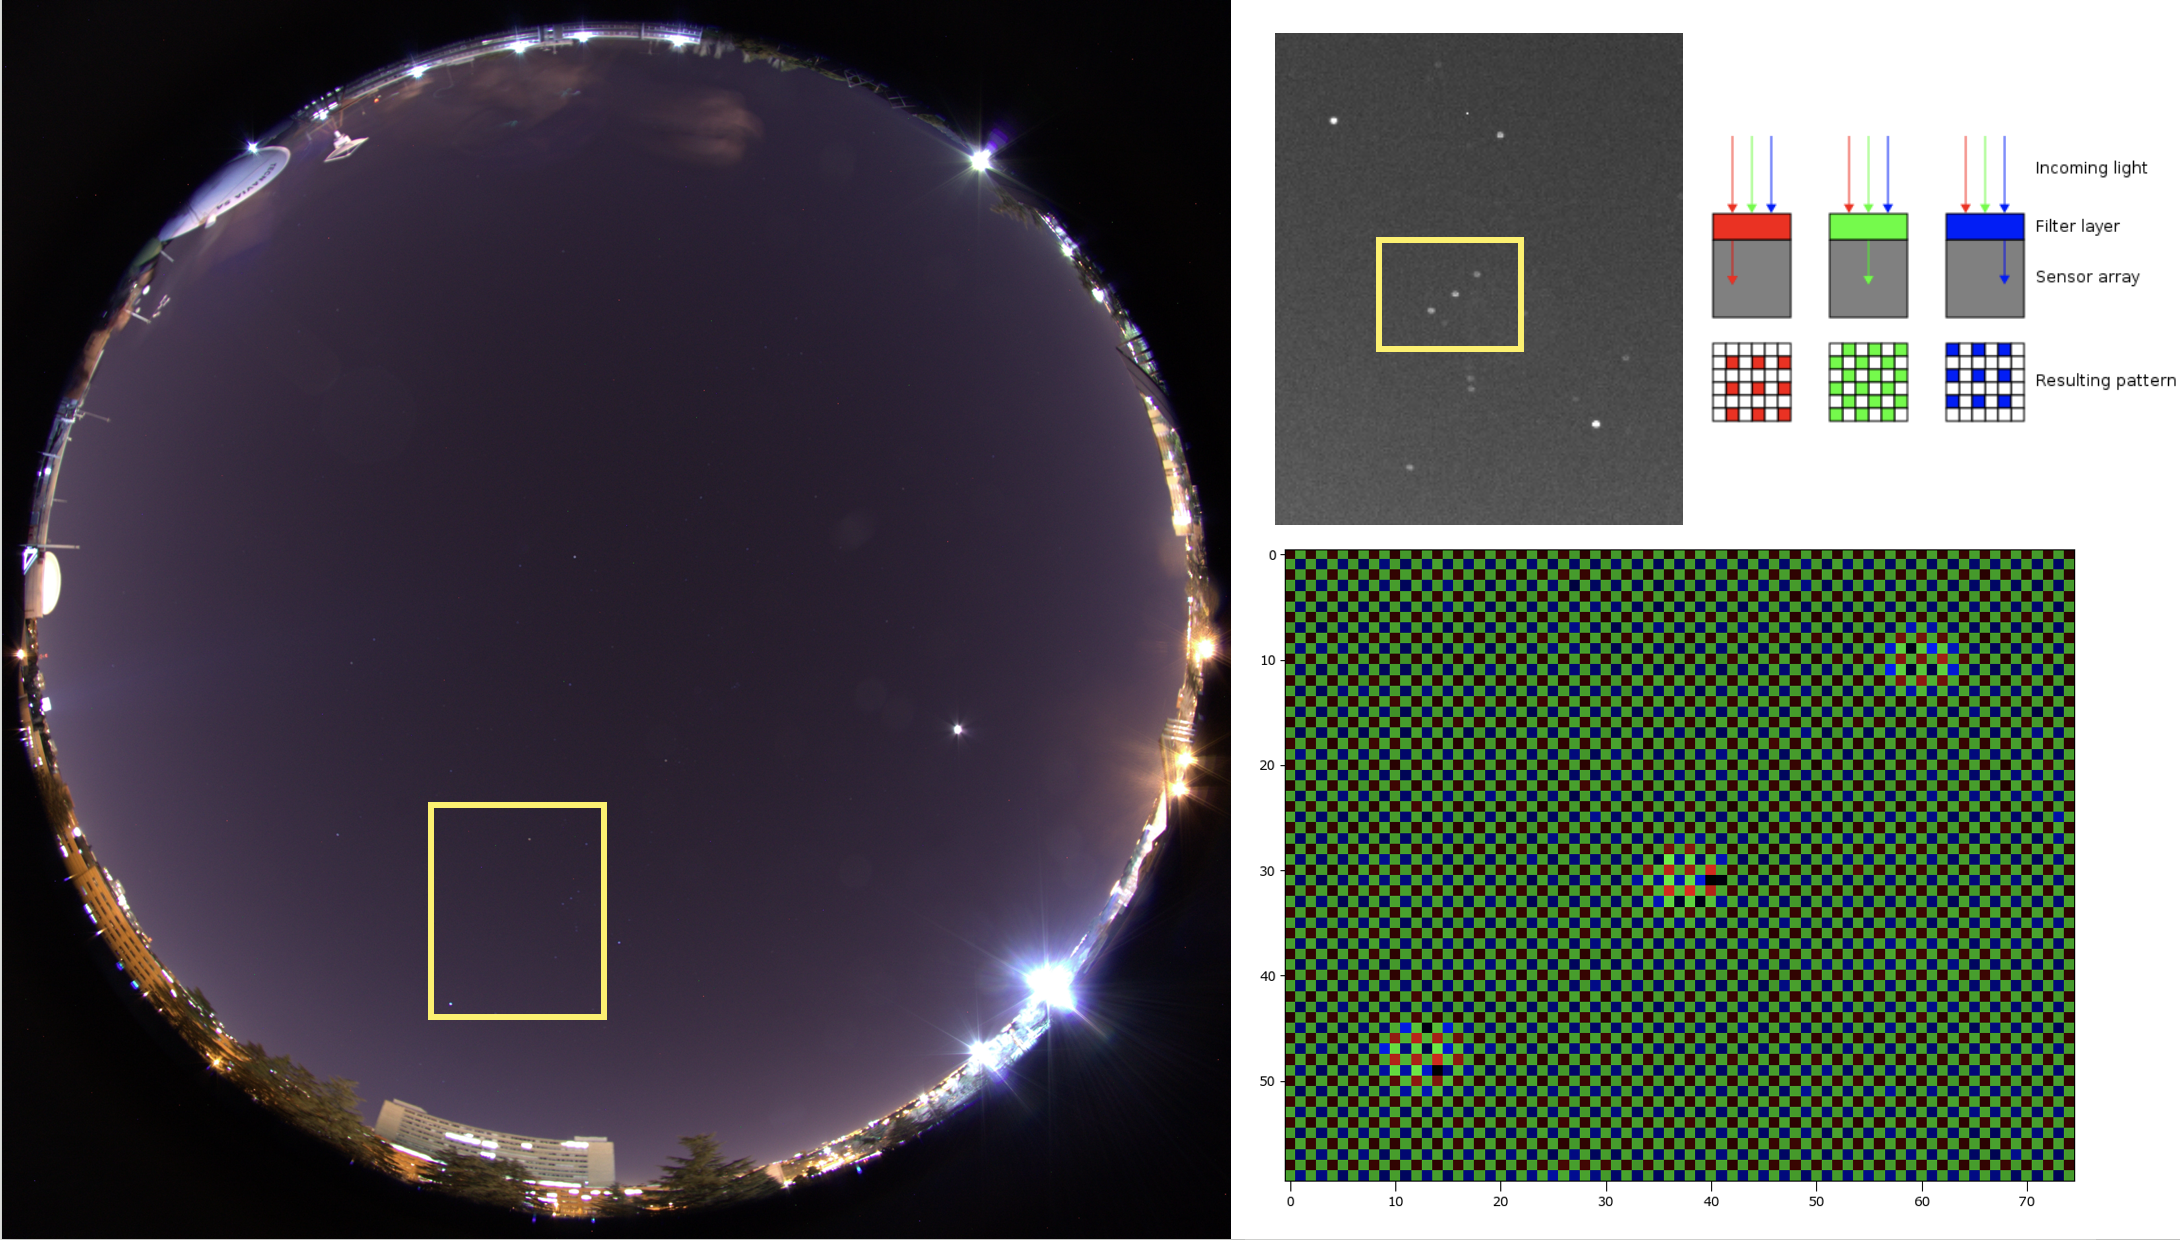
Fig. 31 DSLR pictures have information in three channels (RGB). This all-sky picture was taken from the astronomical observatory of Universidad Complutense de Madrid (UCM). The details of the Orion belt stars in RGB are shown.#
The result after debayering (split the RAW picture into the 4 channels) are 4 images whose intensity is related to the amount of photons detected. If the CMOS sensor is linear then this relationship is proportional: double of counts means double of photons. This is why for the observations and analysis of evolution it is not necessary to use a calibrated camera.
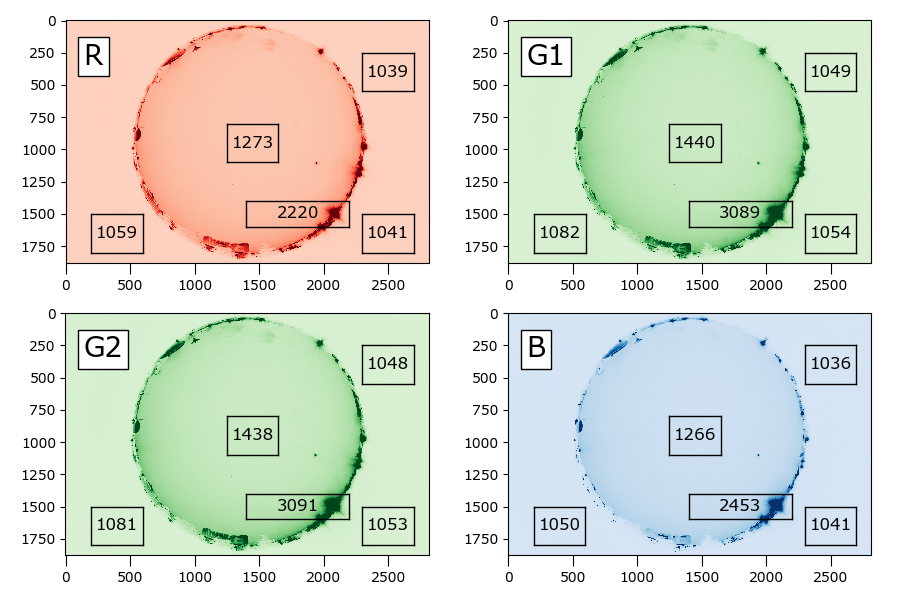
Fig. 32 After debayering the RAW picture is converted into 4 images corresponding to the RGGB channels. Numbers refer to mean counts inside the rectangles.#
The light sources that brighten the sky are located nearby and also at some distance. The impact of bright sources as big urban areas can be observed at hundreds of km. The evolution of these contributions can be determined by taking pictures at the same location along the time. The images comparison can detect the direction of the light sources and their intensity. For instance new sources can appear in the horizon in azimuth that were dark in the past.
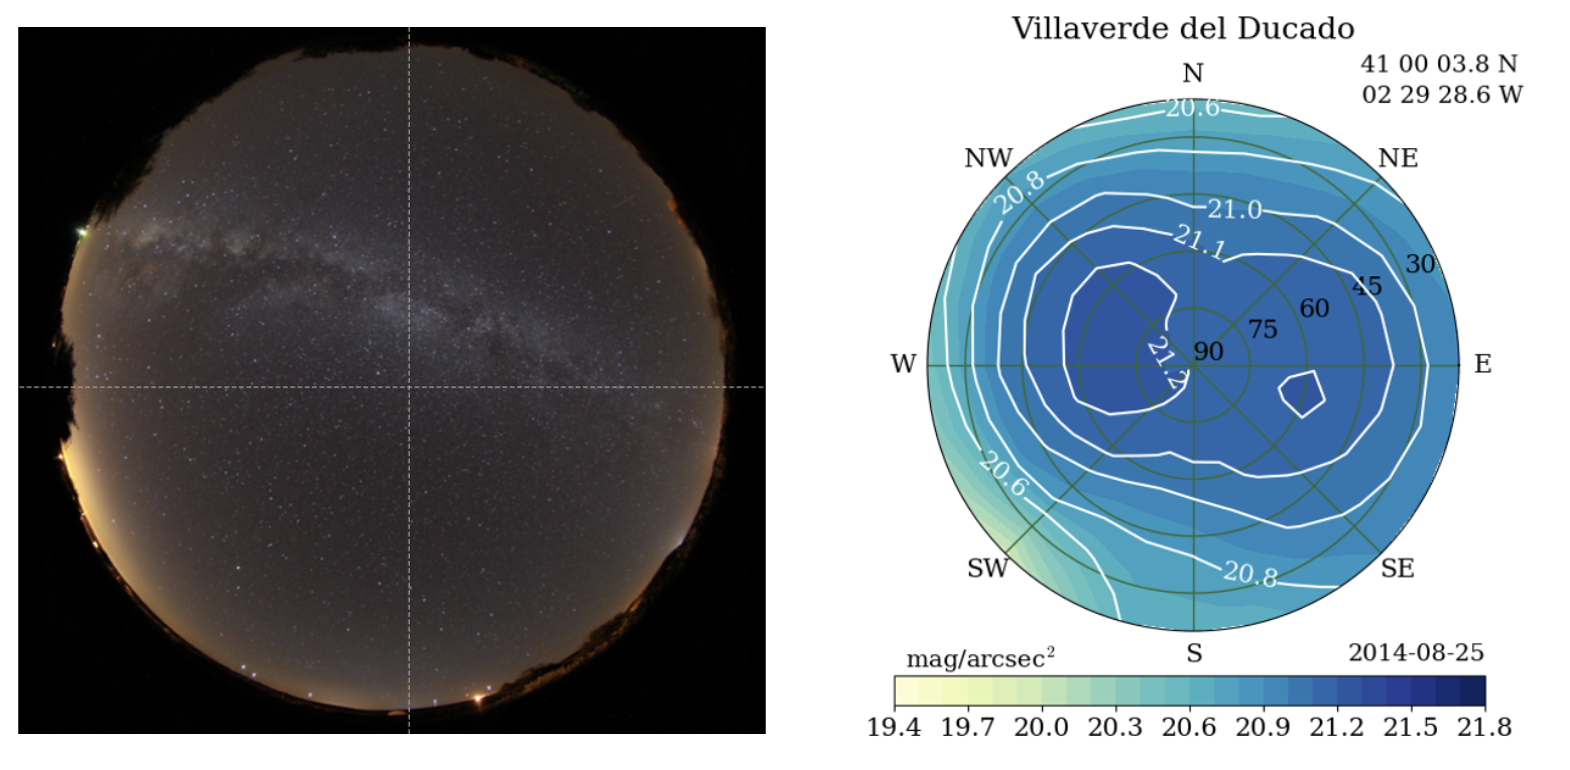
Fig. 33 Bright horizon in SW direction from Villaverde del Ducado indicating the impact of Madrid (at 130km distance). The NixNox map shows the values of sky brightness. The picture and the NixNox observations were taken at different time and the Milky Way is not in the same position.#
Note also that using RGB cameras the evolution can be determined for RGB colors, i.e. we can detect changes in lighting technologies from HPS lamps to LEDs, most of them bluer than the HPS.
PyASB#
Using the stars recorded in our all-sky pictures it is possible to calibrate the camera and lens system. This is a step forward because we can transform from counts/s to photons. Our calibrated pictures can be converted to all-sky maps in the astronomical sky brightness units of magnitudes/arcsec^2.
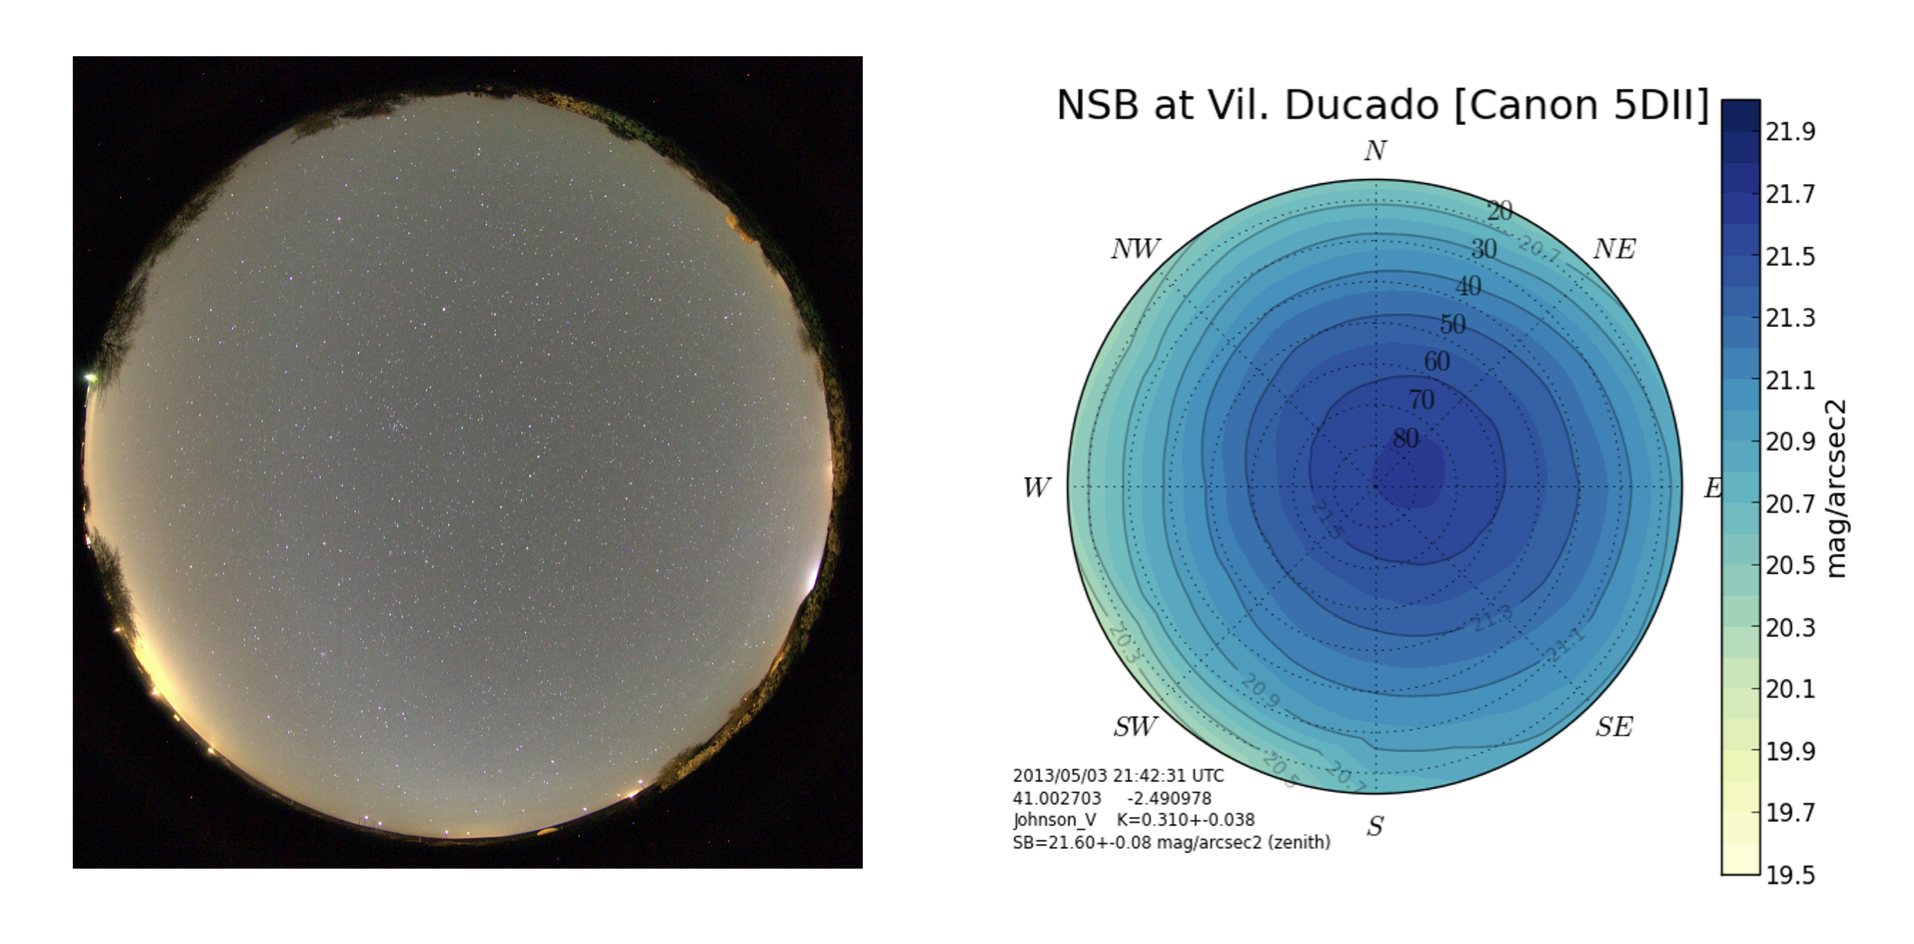
Fig. 34 All-sky picture taken at Villaverde del Ducado and the all-sky map using PyASB.#
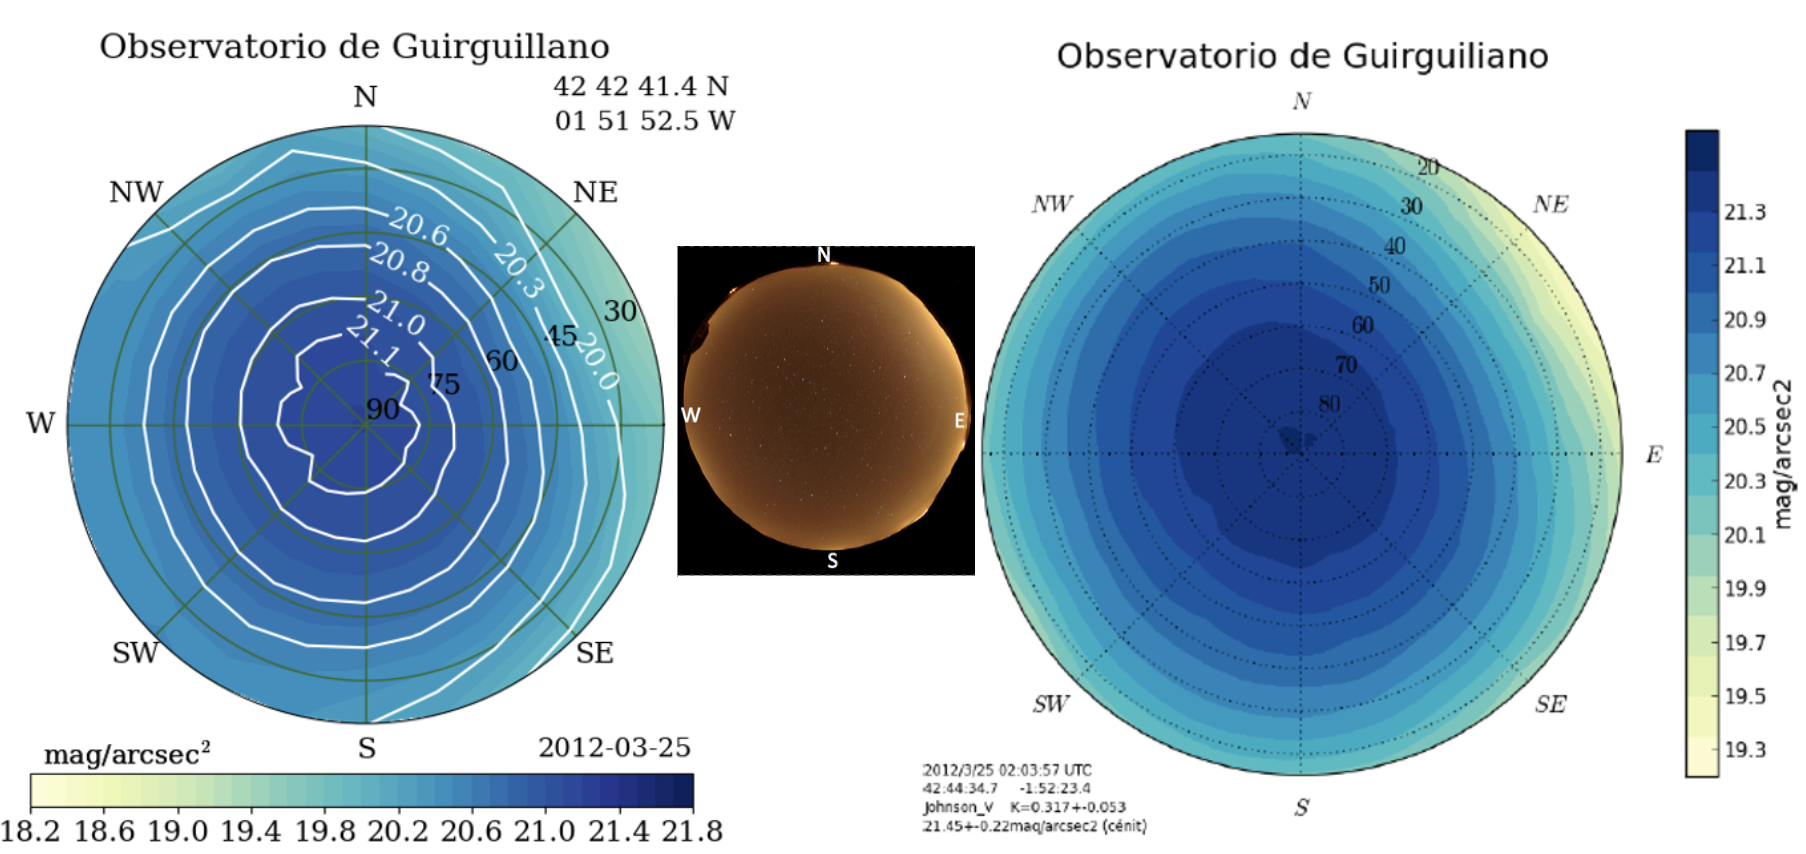
Fig. 35 NixNox map, all-sky picture taken at Guirguillano, and the all-sky map using PyASB.#
PyASB was developed by Mireia Nievas to search and measure the fluxes of the stars in all-sky pictures in order to perform a photometric calibration using the methods of astronomical photometry.
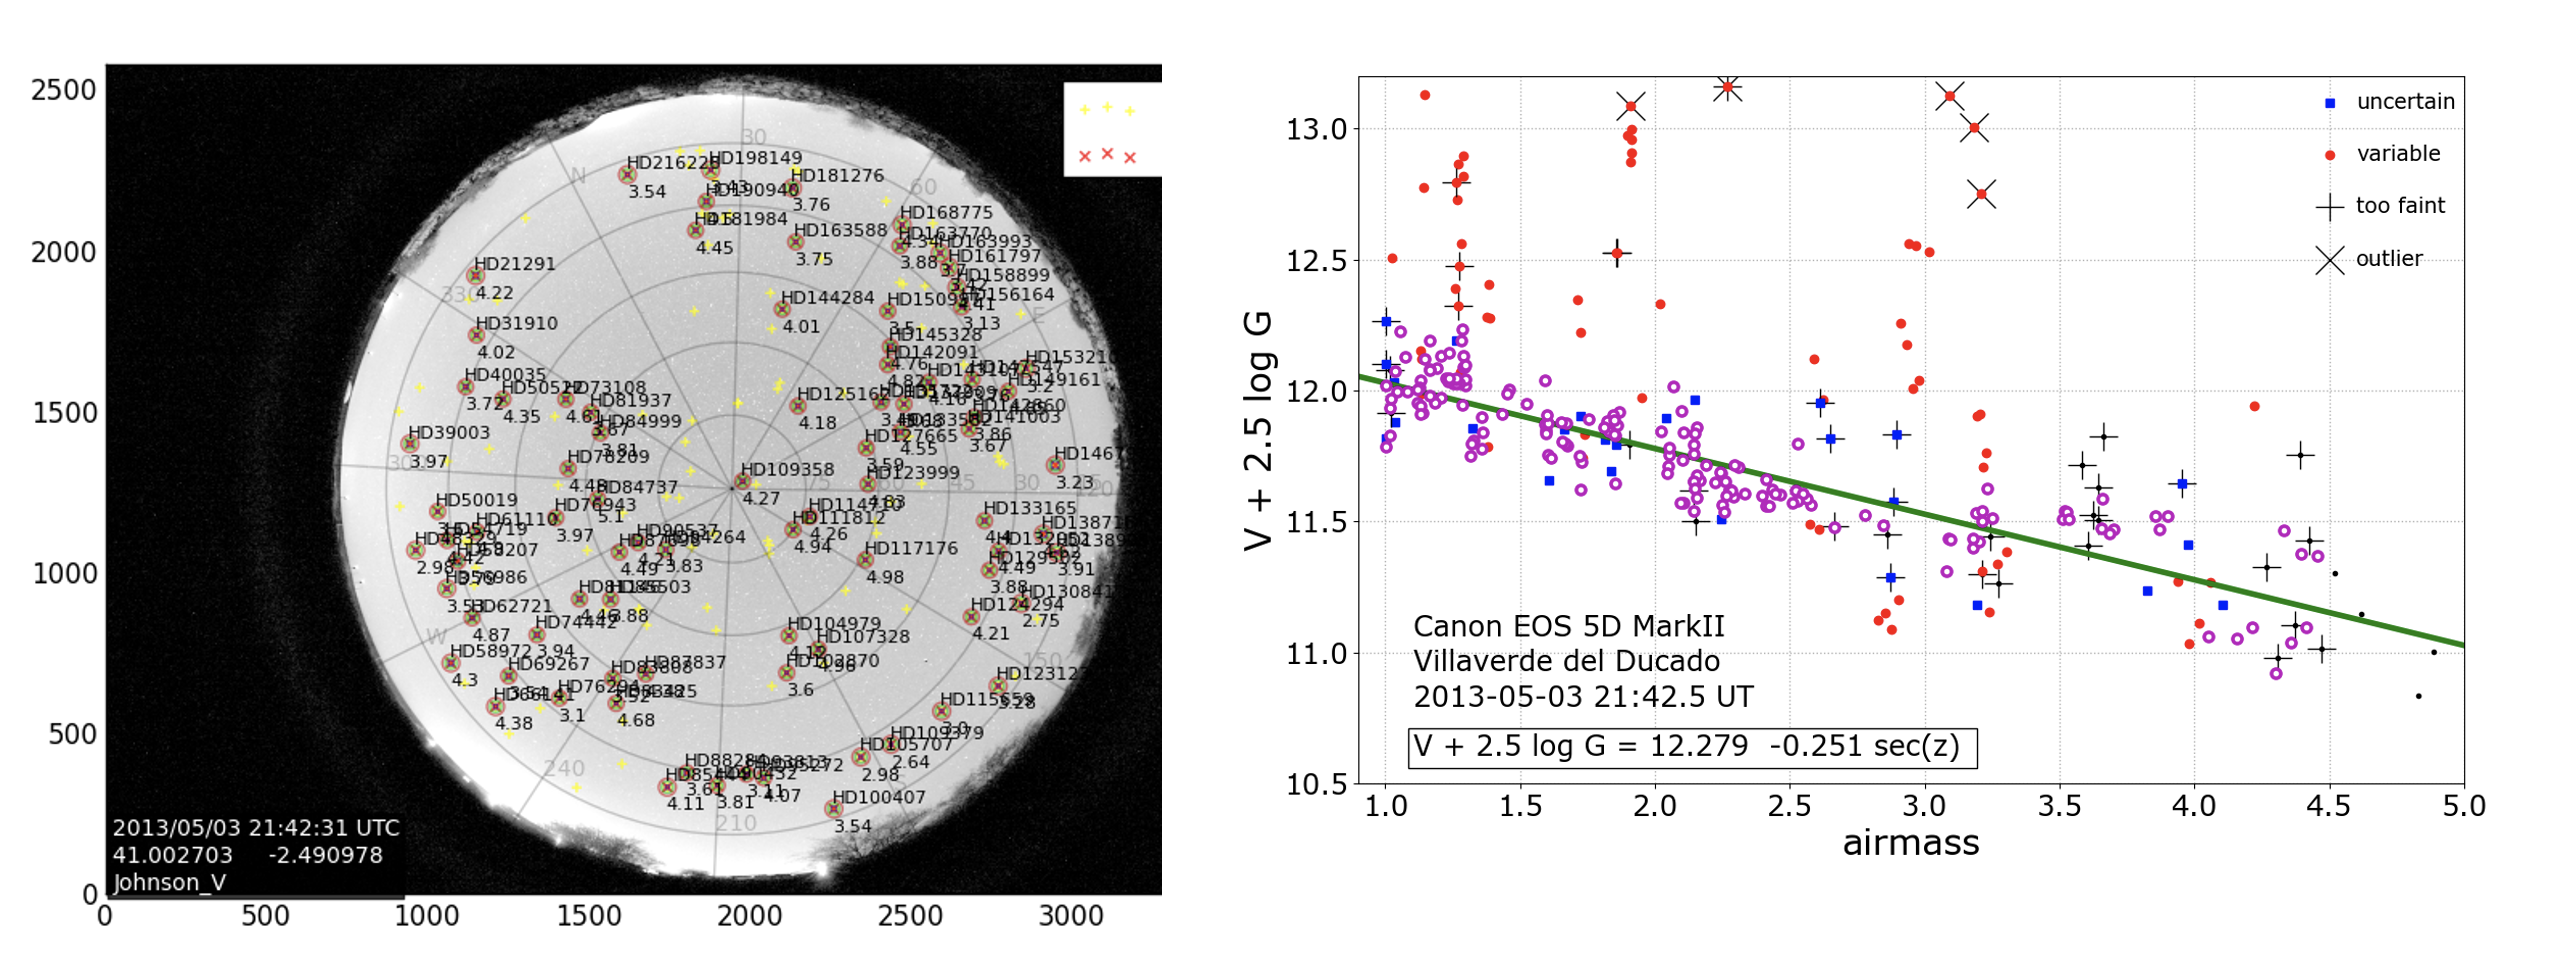
Fig. 36 PyASB method. Detection of the star images and measuring fluxes. The Bouger fit line is used to determine the zero point of the calibration (instrumental constant) and the atmospheric extinction of this night.#
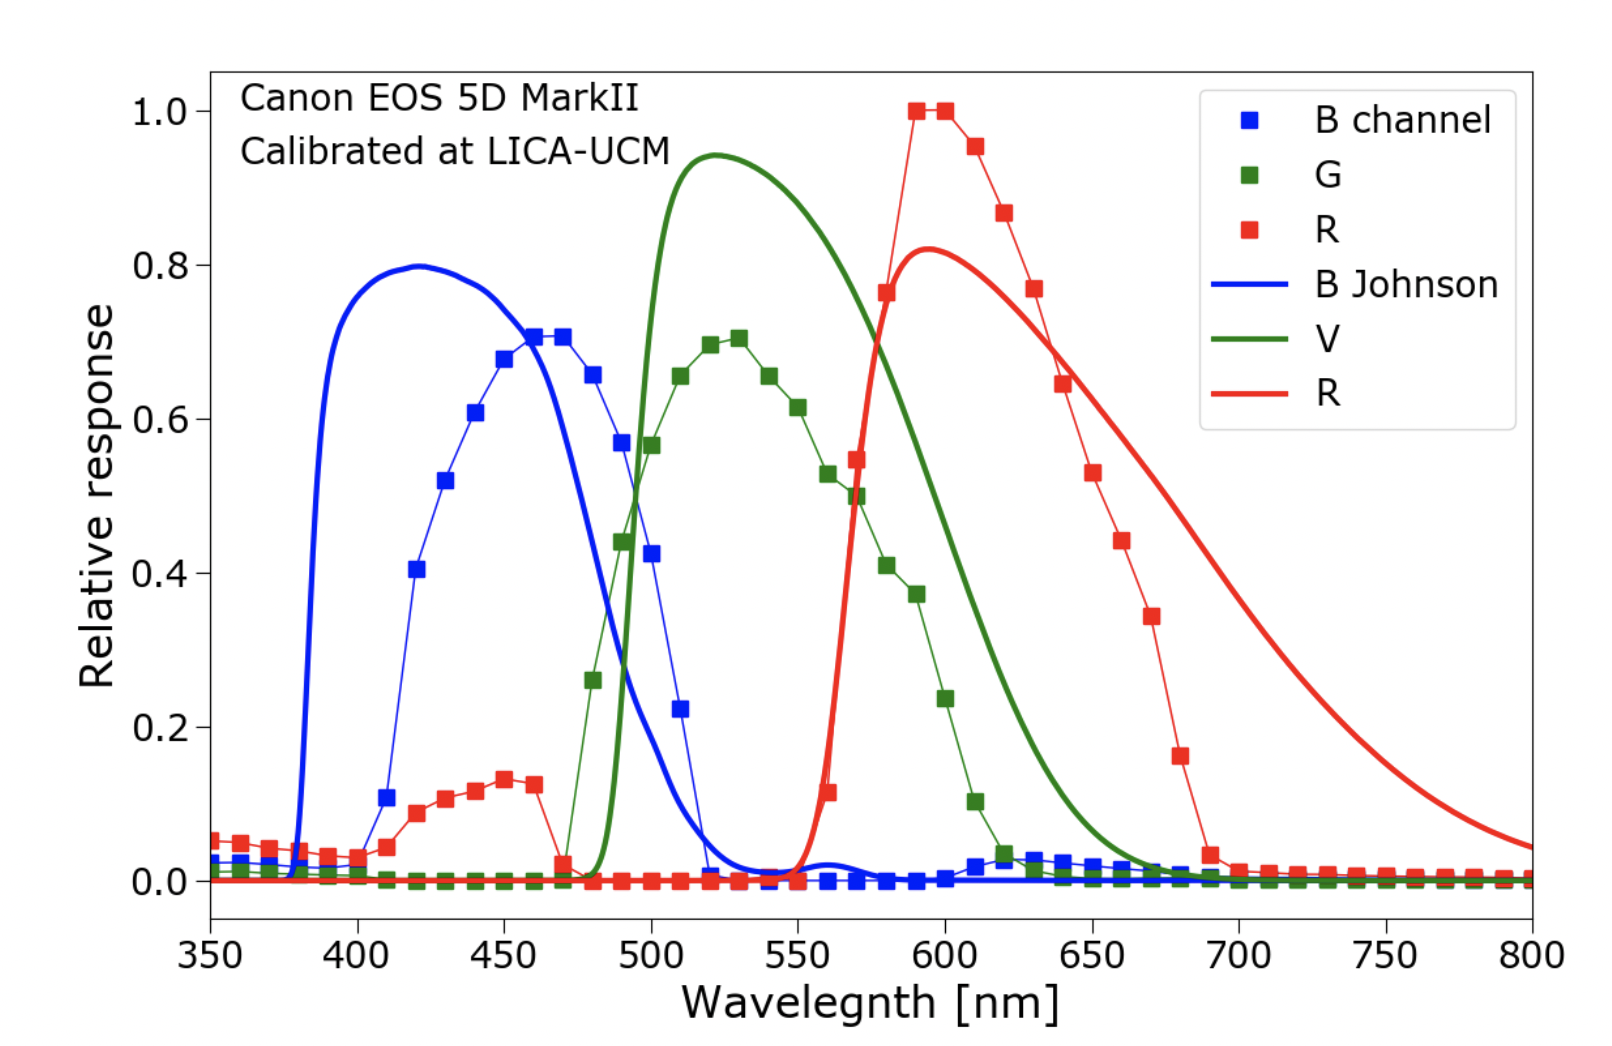
Fig. 37 The response curves for RGB channels of a Canon EOS5D compared with astronomical bands Johnson B, V & R.#
In order to calibrate we compare fluxes (counts/s) of the stars to the published magnitudes of these stars. The filter or response curve of the RGB channels of the DSLRs are not identical to the astronomical Johnson BVR bands. The G channel is similar to Johnson V. This is why the comparison of measured G fluxes to tabulated Johnson V magnitudes works. To perform a better calibration we need to use the magnitudes in the RGB band using the RGB photometry.
AZOTEA project#
The AZOTEA project proposes a study over time of the brightness and color of the night sky through measurements obtained at home with the help of DSLR cameras.
It was started during the 2020 lockdown to answer the scientific question: Which is the impact of human activity in Light Pollution? The brightness of the night sky varies depending on the lights on the street, the movement of cars and the activity of the offices. In big cities that controls the illumination there is a sharp increase in darkness when reducing the the power of the street lights and when, by law, the ornamental lights go out at certain time at night. The project tried to detect variations in this sky brightness produced by the lock down to stop the advance of covid-19. From this difference the human contribution in sky brightness can be estimated. Due to the self-isolation we are experience, astronomical observation activities were reduced to those that we could carry out from our home with the instrumentation we happen to have with us.
Some volunteer observers continue to carry on observations following simple instructions. Regarding the Installation the ideal situation for the station is a roof or terrace that allows a direct view of the Zenith (an imaginary point directly “above” a particular location, on the imaginary celestial sphere). In the case of places outside large urban centers with a direct view of their light haloes, we would appreciate the the camera to record that glow. In that case the field of vision should cover the horizon and depending on the objective it will rise 30-45 degrees from there.
A camera shouldn’t be left in the open as it can be damaged by rain. To be able to measure in any situation we must a weather resistant camera housing case. The easiest thing is to use plumbing PVC material. We will have to use something we have at home such as waterproof suitcases or plastic container boxes. A wooden box with a glass top secured with silicone may also work.
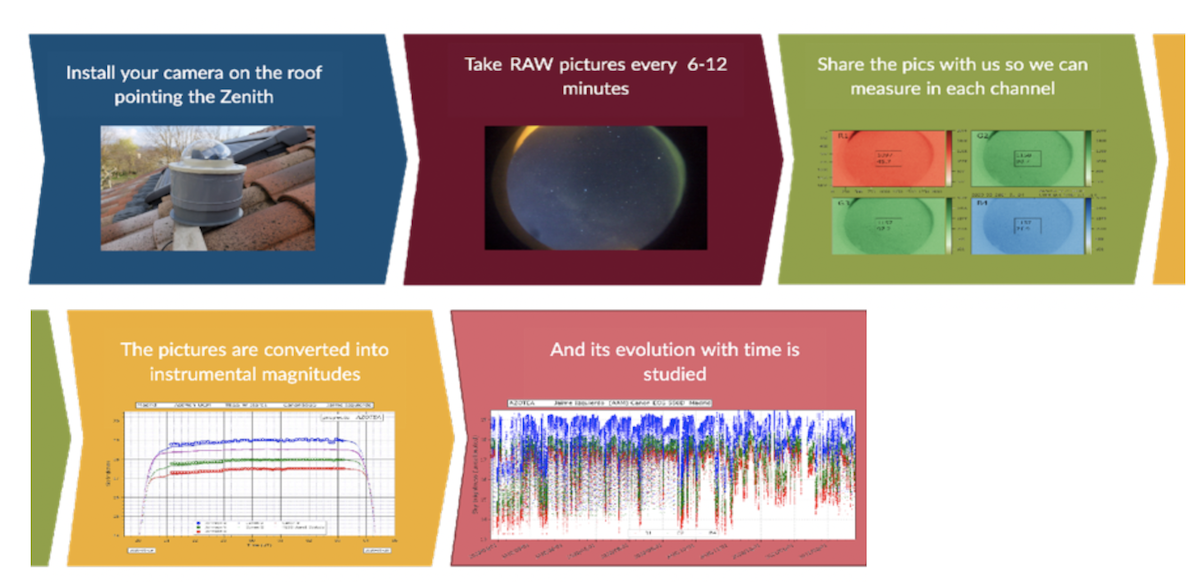
Fig. 38 Flow of AZOTEA from observations to research data.#
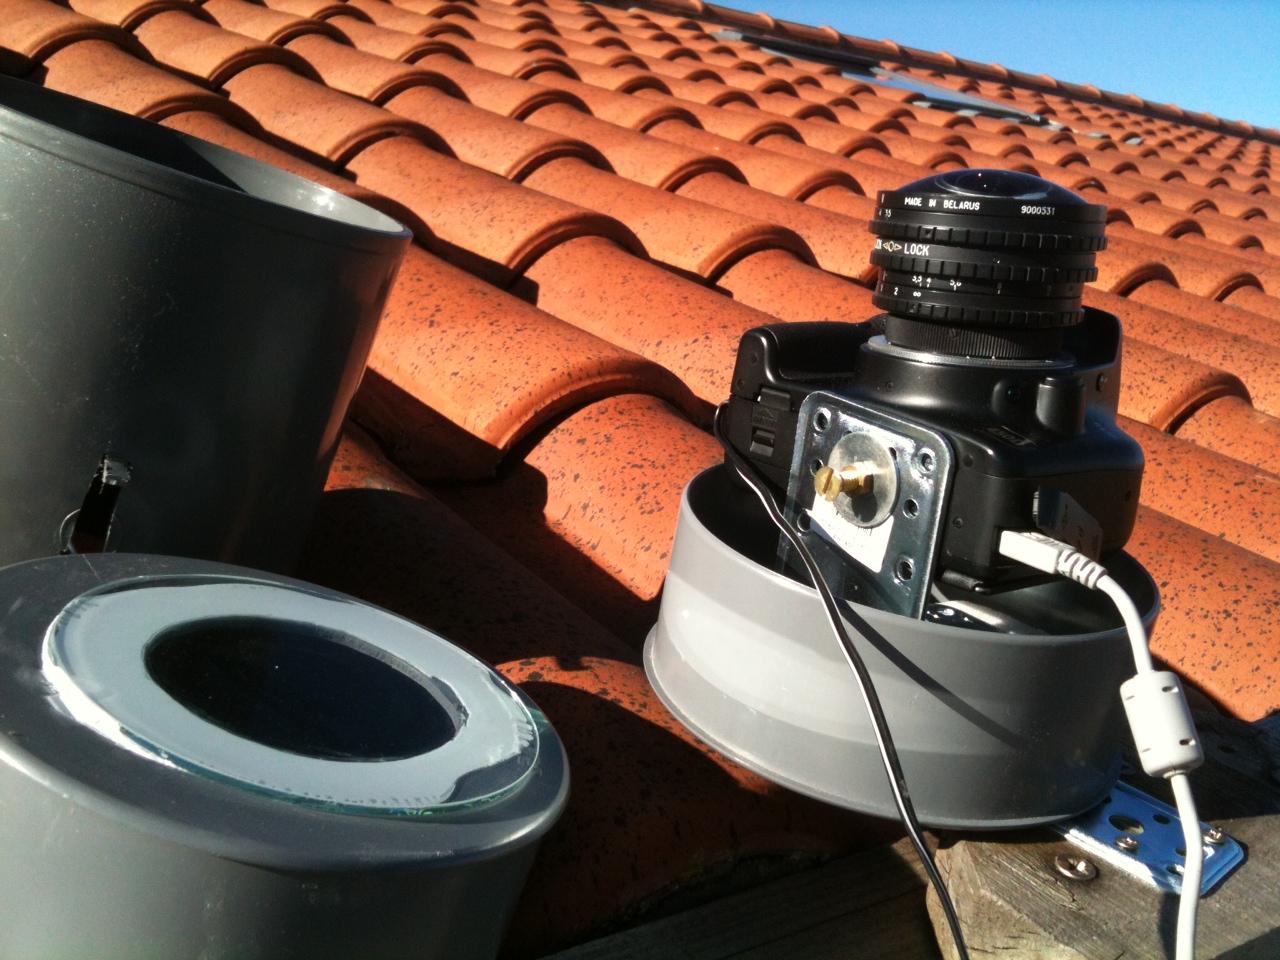
Fig. 39 Example of camera on a roof for the AZOTEA project.#
For more information of AZOTEA browse the AZOTEA webpage and read some results at AZOTEA ALAN2021 poster
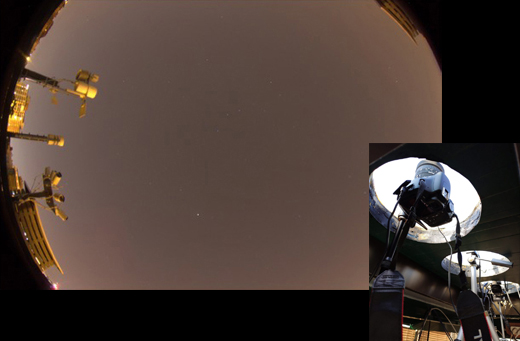
Fig. 40 Example of camera settings of the AZOTEA project.#
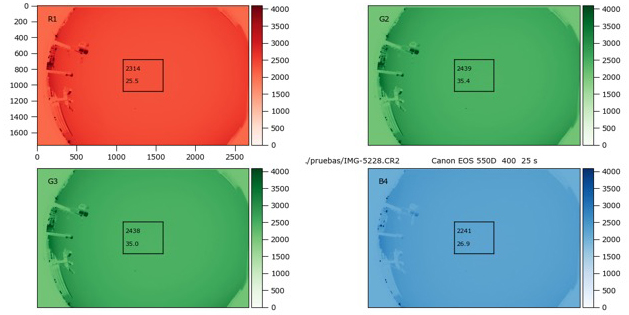
Fig. 41 Results of RGB channels for AZOTEA observations.#
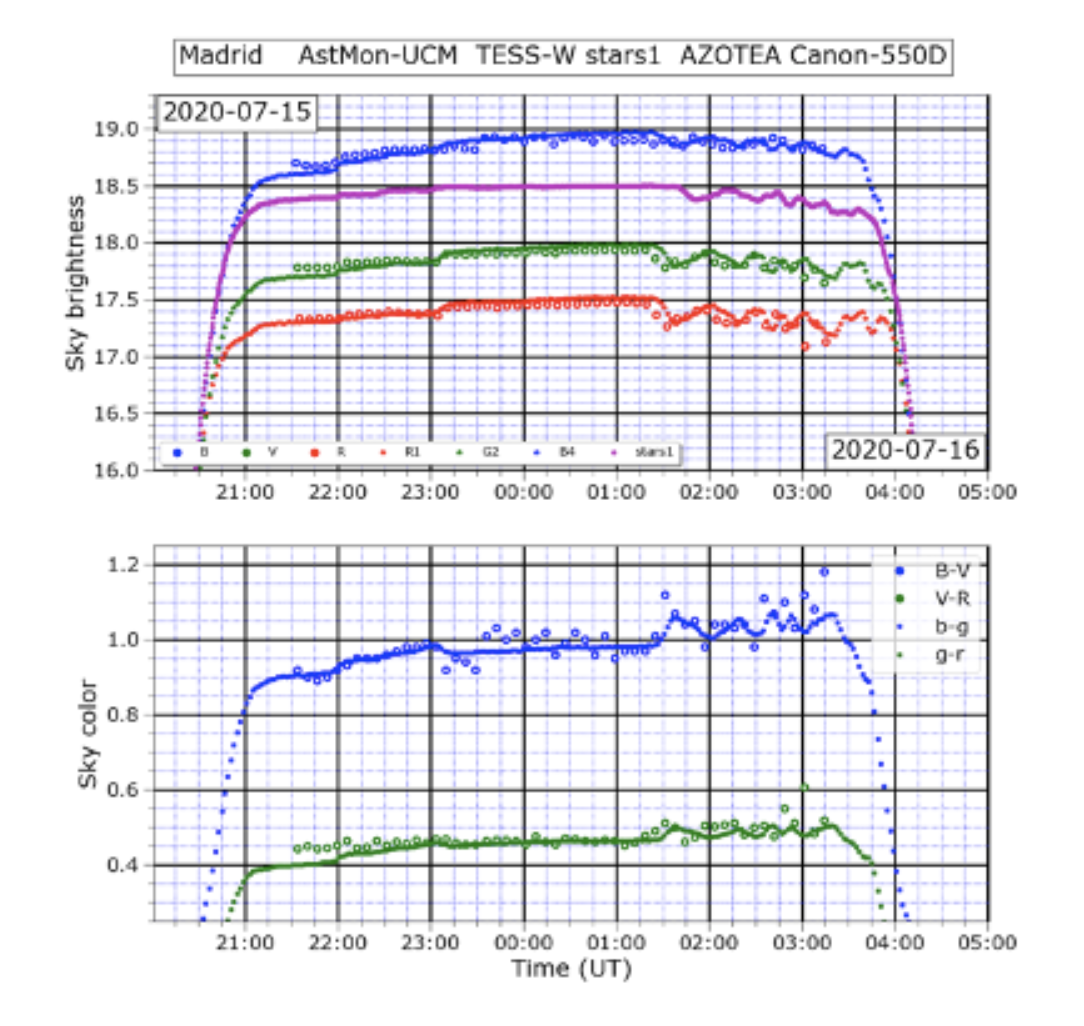
Fig. 42 Evolution of the sky brightness at zenith over the UCM astronomical observatory (Madrid) in Johnson bands. The color evolution of the sky is also shown.#
A comparison of the observations in RGB channels with the Johnson BVR bands obtained with AstMon at Observatorio UCM is shown in Figure X. The RGB observations have been fitted to mach the BVR photometry. Using the calibration shown above we can determine the evolution for all the recorded observations.
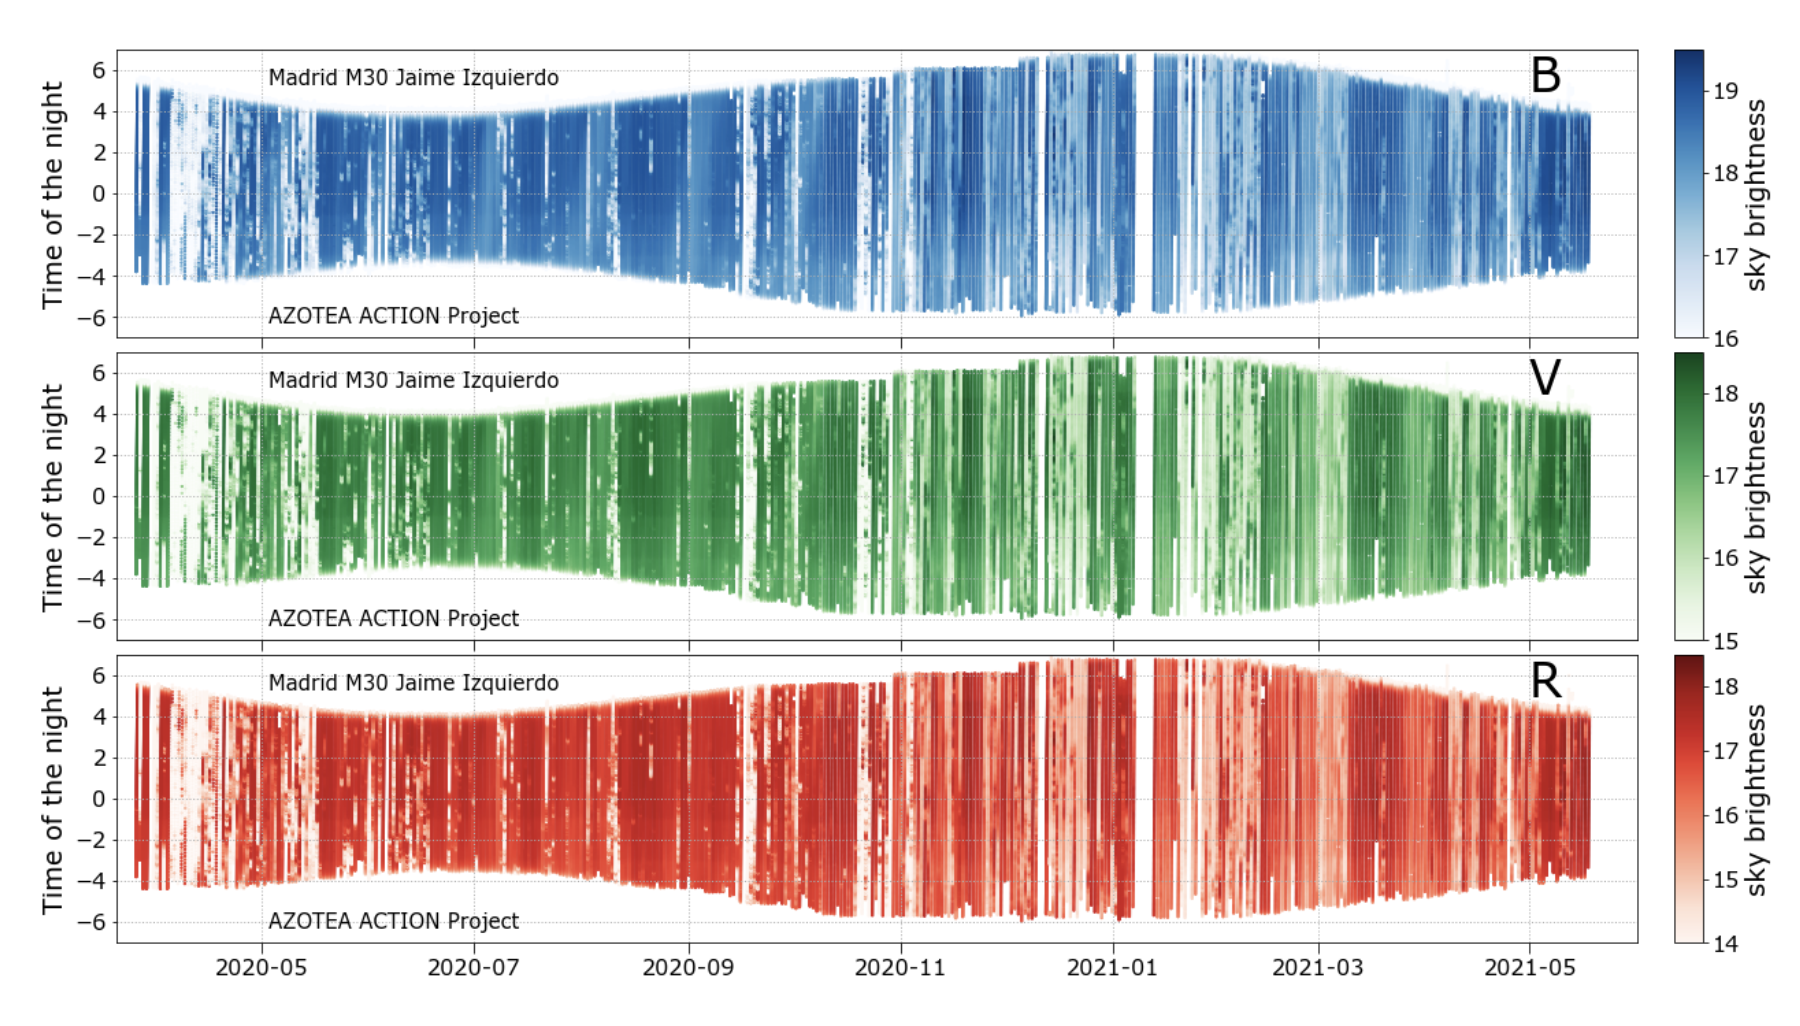
Fig. 43 Graph showing the result for AZOTEA observations in Madrid.#
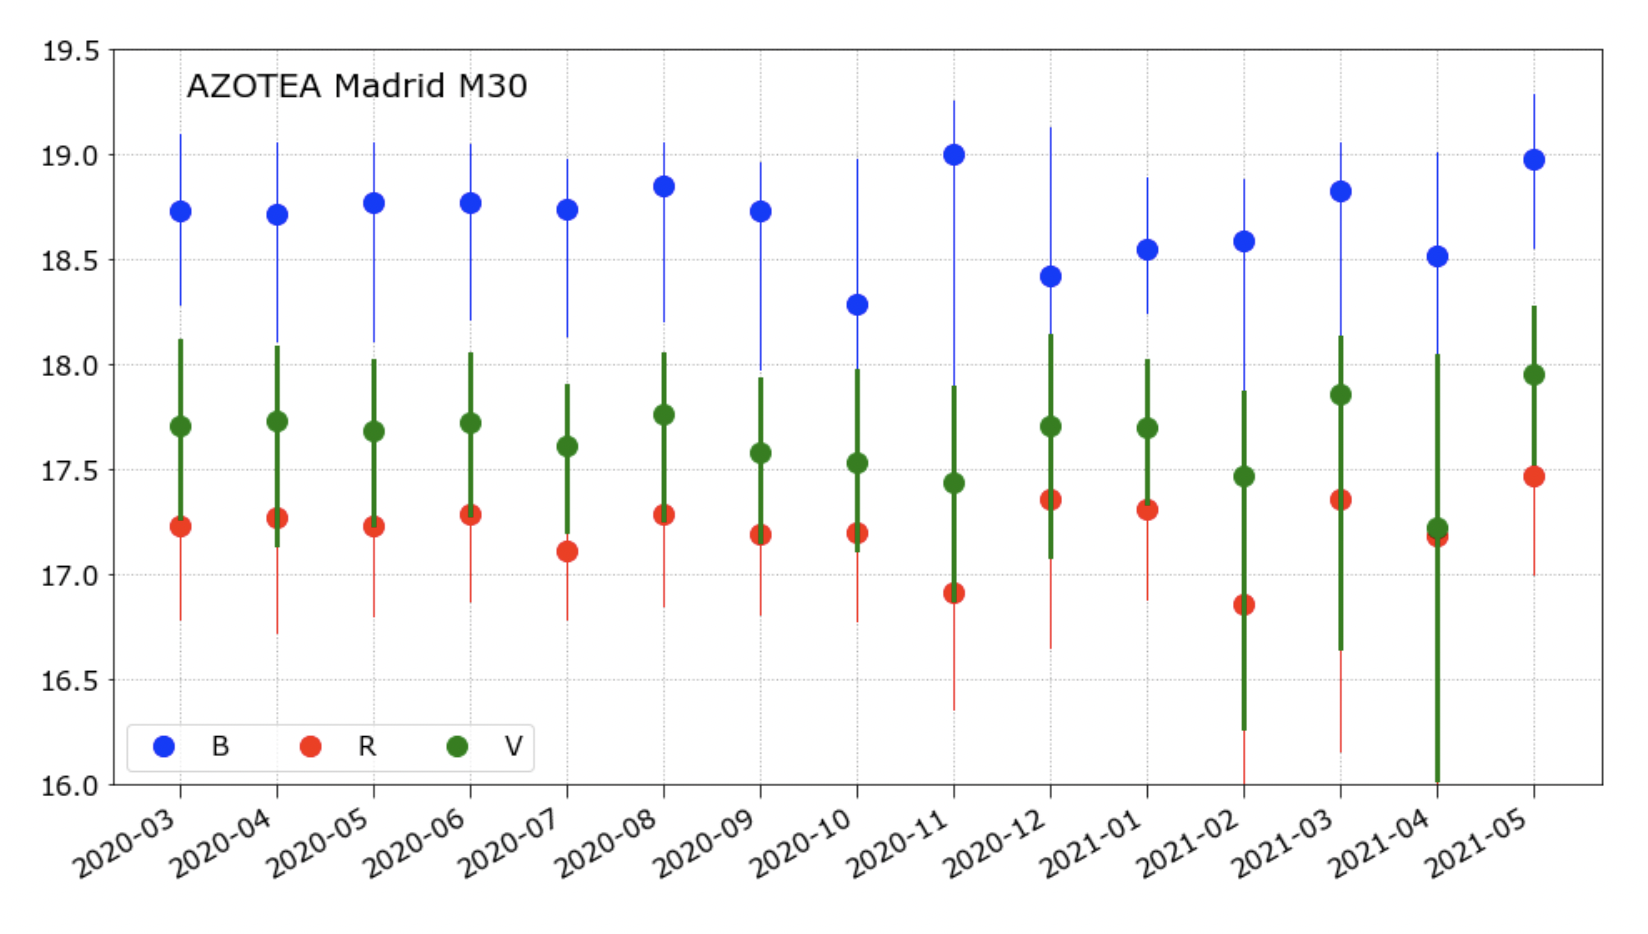
Fig. 44 Evolution of the night sky brightness over Madrid using AZOTEA observations.#
Field observations#
This section contains some tips for the observations needed to study the light pollution using DSLRs. It is written for night sky photographers who can take some research pictures during their nights of observations.
Equipment and settings#
Any off-the-shelf DSLR camera (full-frame or APS) that can record the RAW picture is valid. The RAW or unprocessed file is needed to determine fluxes in counts/s that are proportional to the amount of light. The post processed files as JPEG lost information and are not useful.
The next step is to select the lens. The best choice is to select lenses of our equipment as we do not need especial lenses. The only exception is the fisheye lenses for all-sky. Shorter focal length lenses (wide-angle lenses) are preferred as we wish to get a wider field of view in one picture.
The aperture of the lens determine the amount of light collected. In these observations we plan to use a photographic tripod with no tacking and enough time exposure and we could select in principle any aperture. It is recommended to use the lens fully open to guarantee that any time that you set this aperture the position is the same. Be cautious because there are small differences when returning to intermediate apertures.
The rest of the settings should be determined after some tests. Focus to infinity as usual. Select ISO settings. Determine the exposure time by checking the results. Since a bright glow in the horizon could be saturated for long exposure it is recommended to shots at different exposure times. For instance 2, 4, 8, 16 s to obtain some sub exposed pictures.
Pointing#
To study the light pollution at some location we should observe the horizon in all azimuths. It is necessary to take pictures using a photographic tripod with a head that can be rotated to any know angle.
For a full 360 panorama we can determine in advance the amount of shots in order to cover the whole circumference with overlapping pictures. For example a 20mm lens in a full frame camera covers 84.0 x 61.9 degrees. We need 360/84= 4.3 or at least 5 shots. If we use 6 shots for the panorama we should rotate 60 degrees from shot to shot and the overlapping is 84-60 = 24 deg.
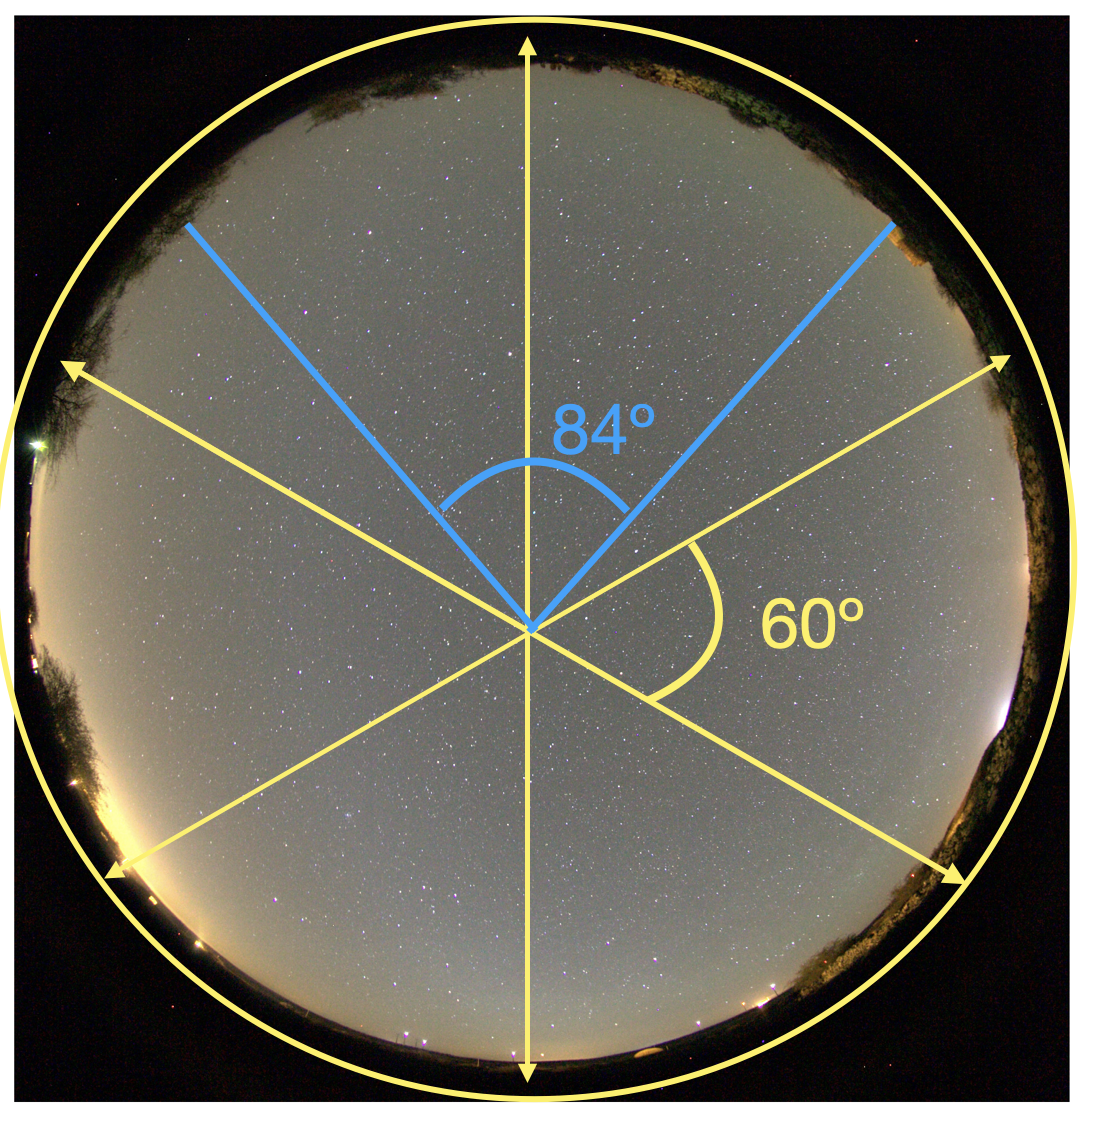
Fig. 45 Example of panorama with 20mm lens on full frame. Six shots every 60 degrees covers the whole circumference.#
Examples#
The pictures in Fig. 46 and Fig. 47 show good examples of shots with horizon.
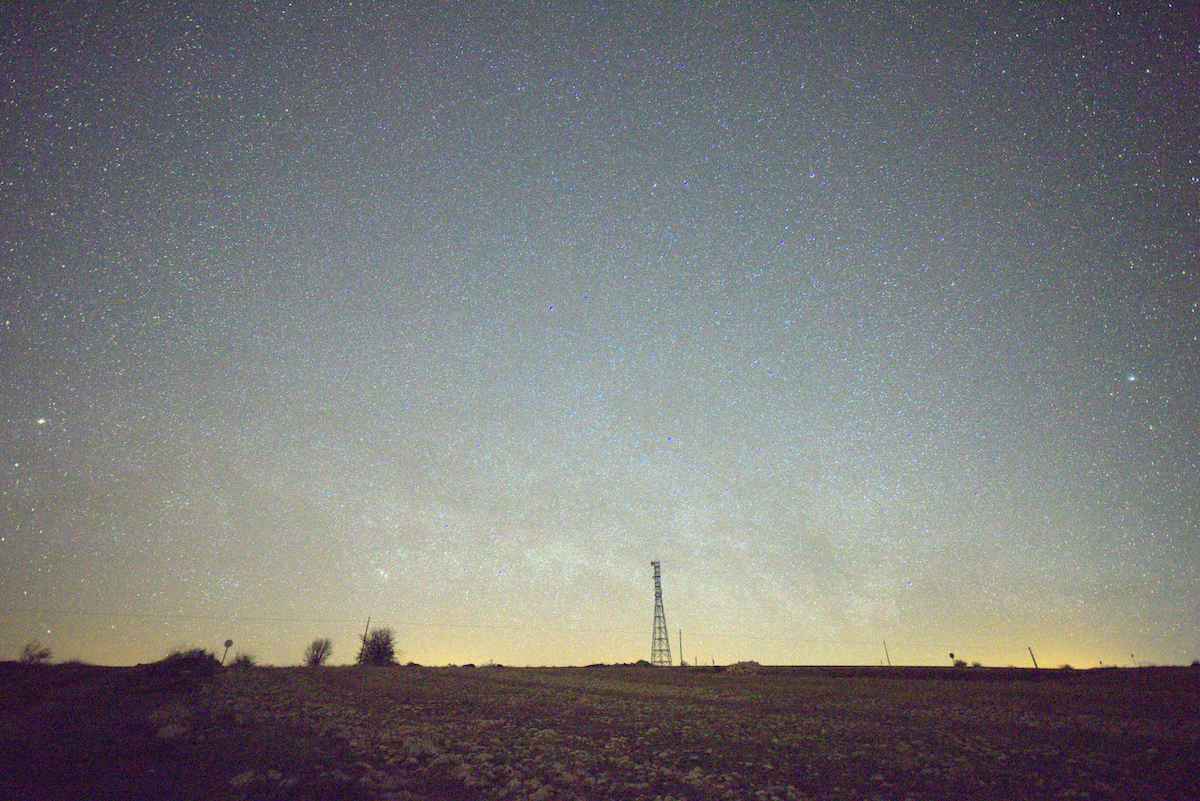
Fig. 46 Example of picture including the horizon. The tower and details in the horizon will help to compare with other shots taking at different epochs. (Villanueva de Alcorón, lens: Irix 15mm, -M1A7323-2021 by Rubiel Andrés)#
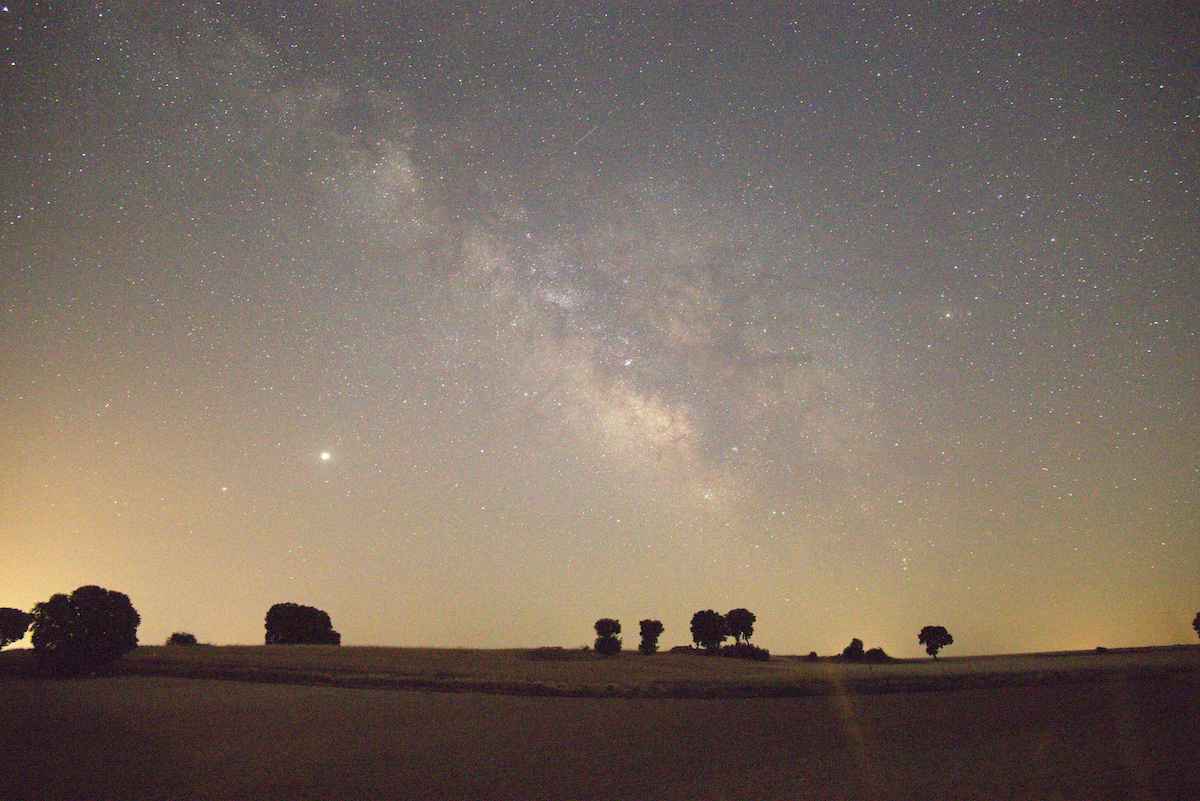
Fig. 47 Example of picture including the horizon. The threes in the background will help to register with pictures taken from the same location in different epochs. (Brihuega, IMG-4334-6DMKII-2021 by Rubiel Andrés)#
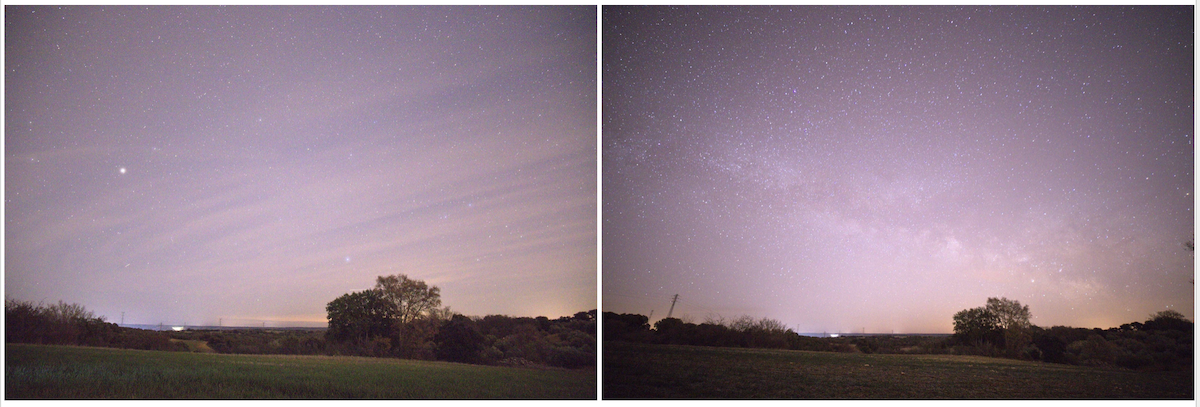
Fig. 48 Example of picture including the horizon taken at Observatorio-de-Yebes, with Canon EOS6D MKII 2018 & 2020 by Rubiel Andrés.#
The pictures in Fig. 48 shows two shots from the same location and direction. Unfortunately, the focal length differs and the Field of View (FoV) is different. This is a problem when comparing the two shots.
2020-02-25 22:53:38 lens: 24-105mm, exposure: 15s ISO 2500 f/3.5 f=24mm
2018-02-13 06:27:30 lens: 15mm, exposure: 20s ISO 4000 f/2.5 f=15mm
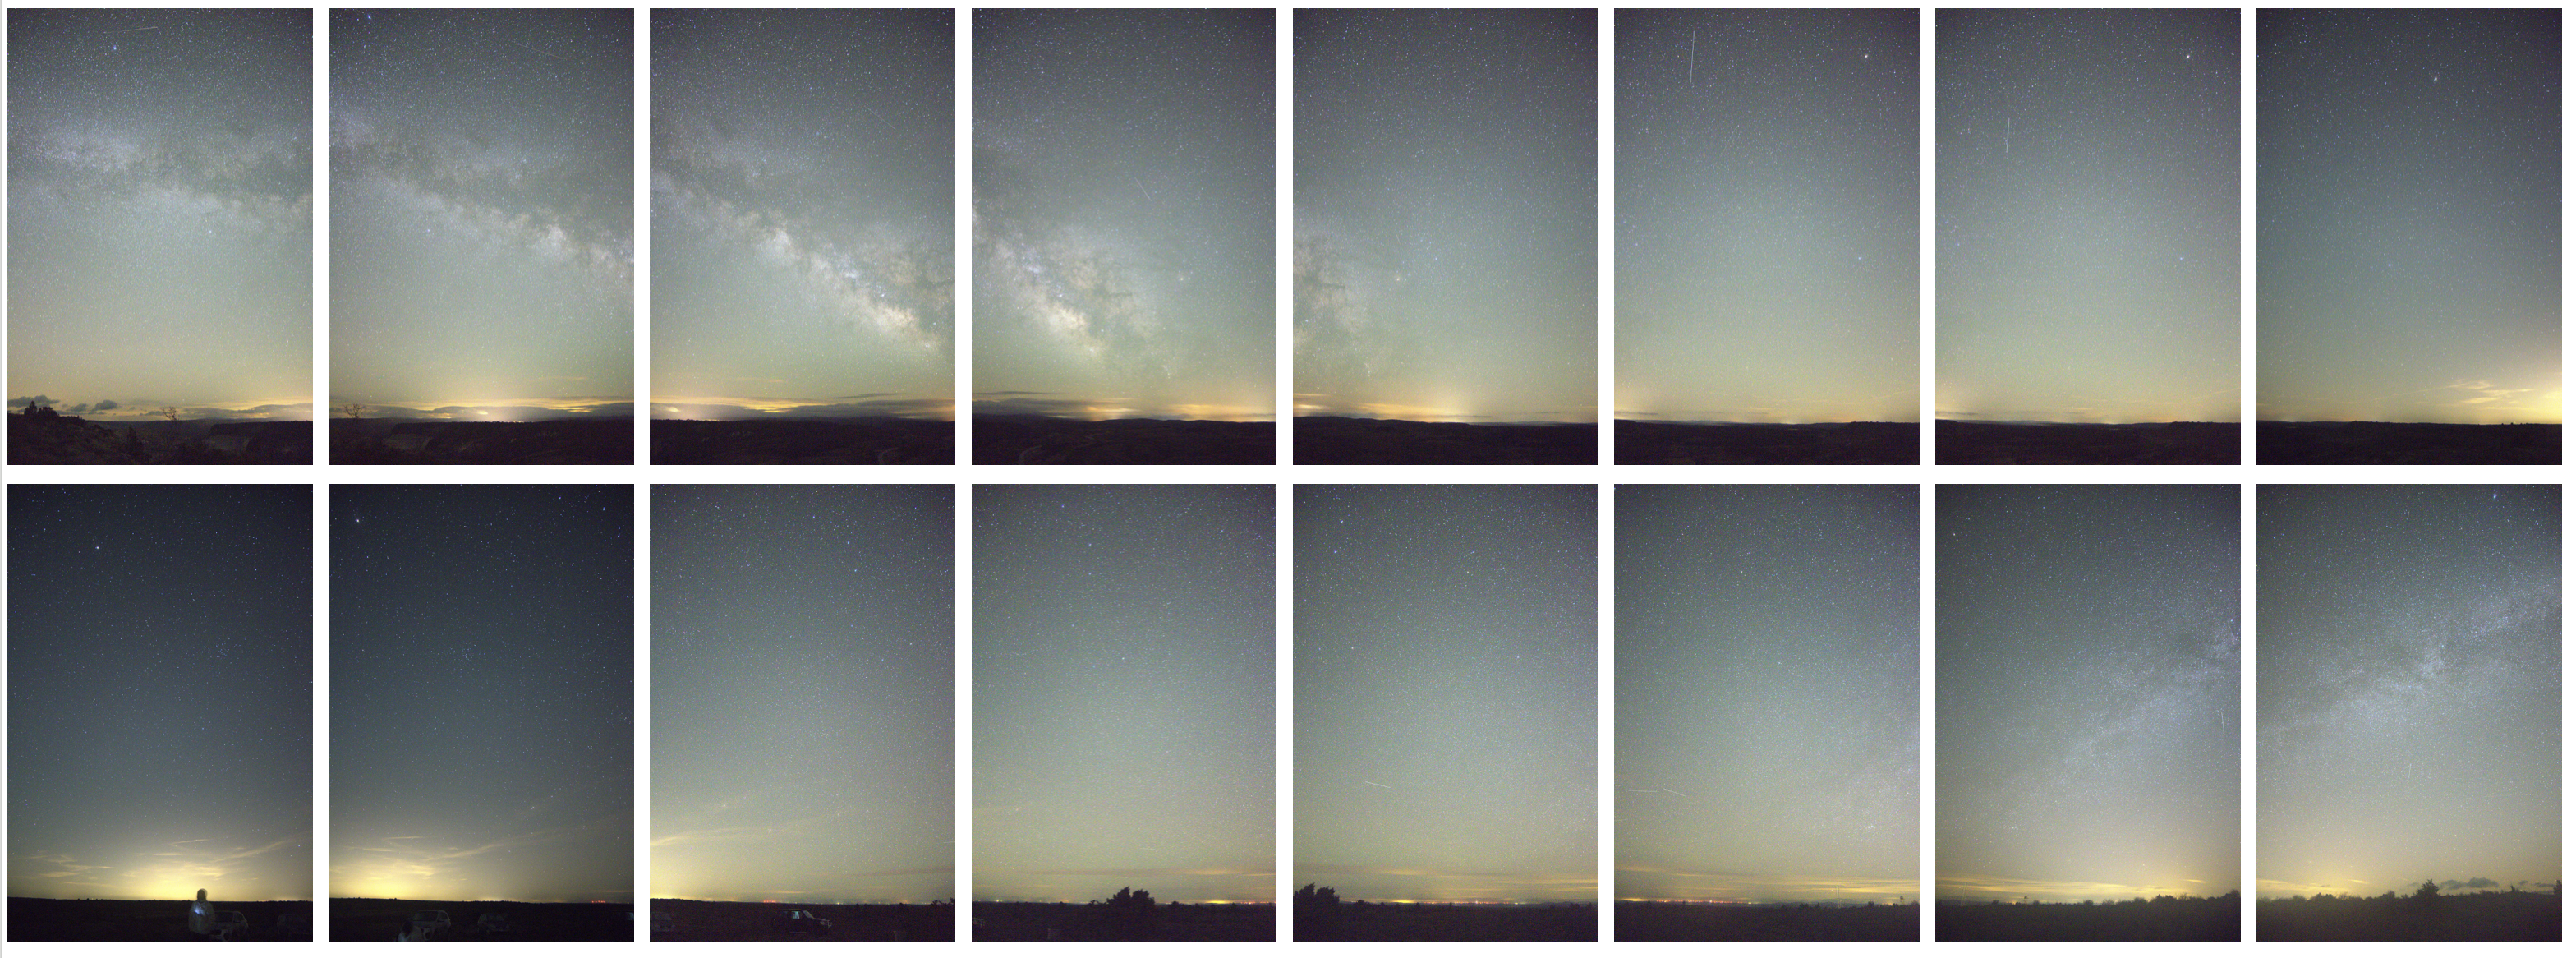
Fig. 49 Example of pictures taken for panorama composition with Canon EOS6D MKII and 24mm lens by Rubiel Andrés.#
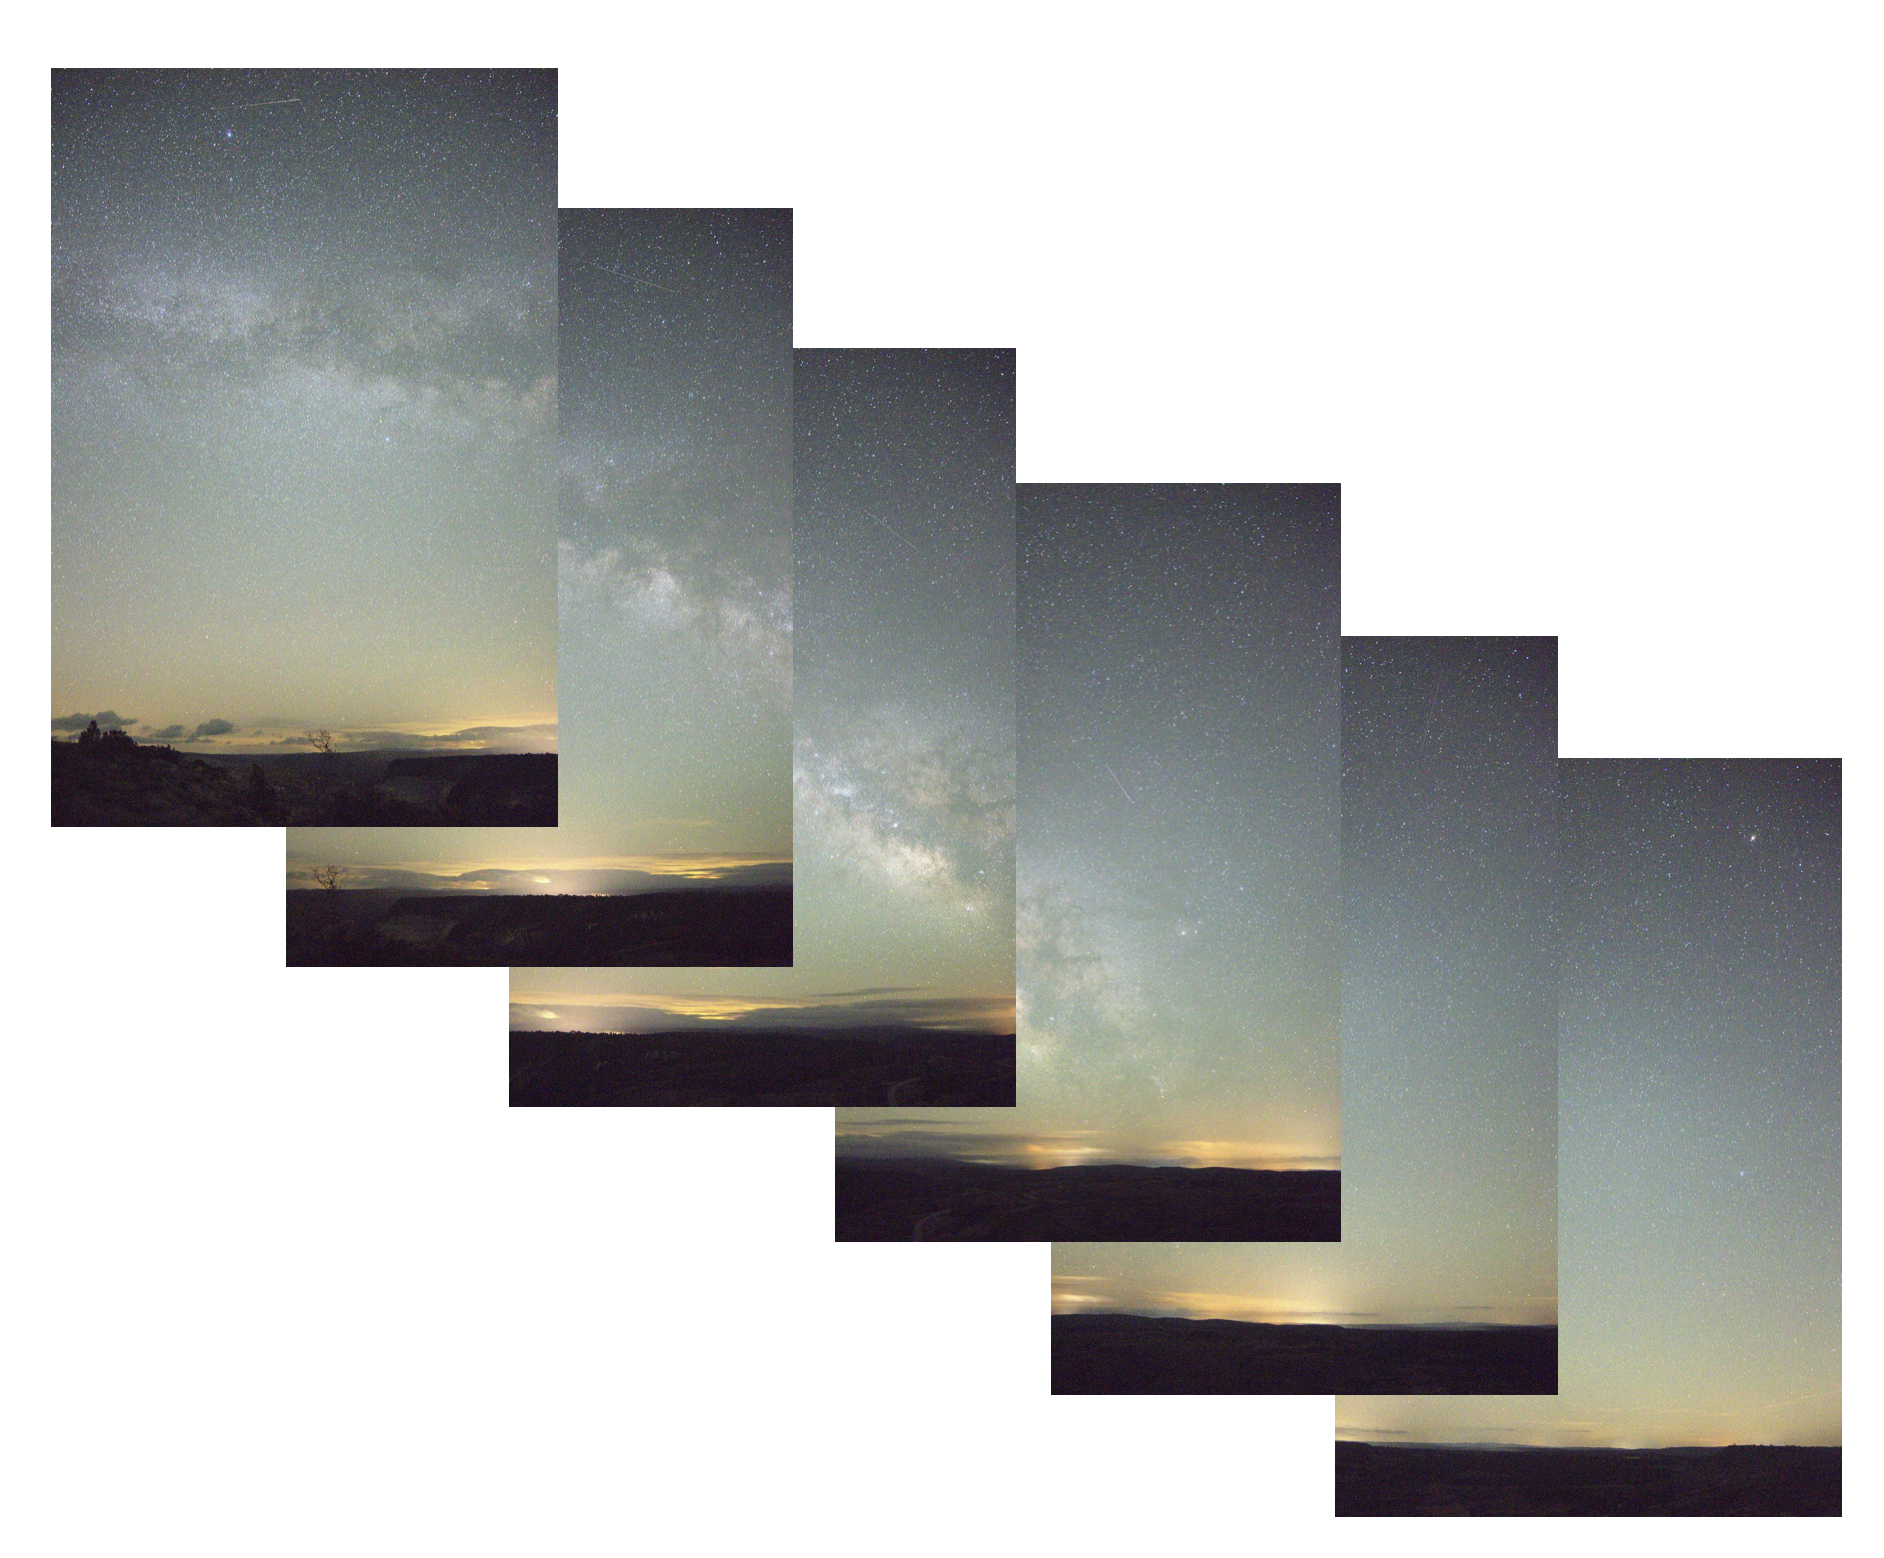
Fig. 50 Showing the overlapping of individual shots of the panorama series.#
