S9705-01DT photodiode for light pollution studies
Contents
S9705-01DT photodiode for light pollution studies#
title: S9705-01DT photodiode for light pollution studies
authors: Cristóbal García, Jaime Zamorano & Rafael González
Departamento de Física de la Tierra y Astrofísica Laboratorio de Instrumentación Científica Avanzada (LICA) Universidad Complutense de Madrid (Spain)
LICA report January 2022 version 1.0
This document is private. Not for public release
Abstract#
We have performed some tests to determine the viability of using the light-to-frequency converter photo IC Hamamatsu S9705-01DT for measuring the night sky brightness.
Introduction#
Universidad Complutense de Madrid designed a photometer (European project STARS4ALL) to measure the night sky brightness using the AMS TSL237 light-to-frequency sensor. Browse for more information the TESS webpage . This sensor is the same used by a similar photometer: the Unihedron Sky Quality Meter (SQM). As the sensor is cheap, we could design a low budget photometer to be acquired and used in citizen science projects. The design, software, hardware and data are open source.
We are looking for replacements for the TSL237 since the manufacturer of TSL237 has announced that it will be discontinued. Some samples of Hamamatsu S9705-01DT were kindly provided by Víctor Bernardo (Key Account Optoelectronics, Spain) and were analysed at Laboratorio de Instrumentación Científica Avanzada of Universidad Complutense de Madrid (UCM-LICA) and during some field campaigns.
Hamamatsu S9705-01DT#
From the manufacturer webpage “The S9705-01DT is a photo IC that combines a photodiode and a current-to-frequency converter on a CMOS chip. Output is a square wave (50 % duty ratio) with frequency directly proportional to light intensity incident on the photodiode. The CMOS level digital output allows direct connection to a microcontroller or other logic circuitry. The S9705-01DT has a wide dynamic range and light intensity can be easily measured when used with a digital counter.”
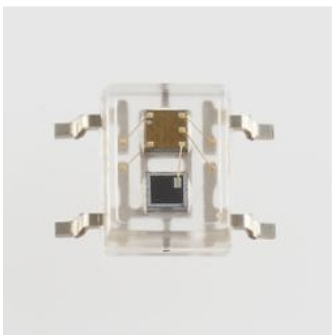
Main Features
Converts light intensity to frequency
Wide dynamic range: 5 orders of magnitude
Excellent linearity
Output timing reset function
Digital output for direct interface to microcontroller
4-pin plastic package
Tests#
Setup#
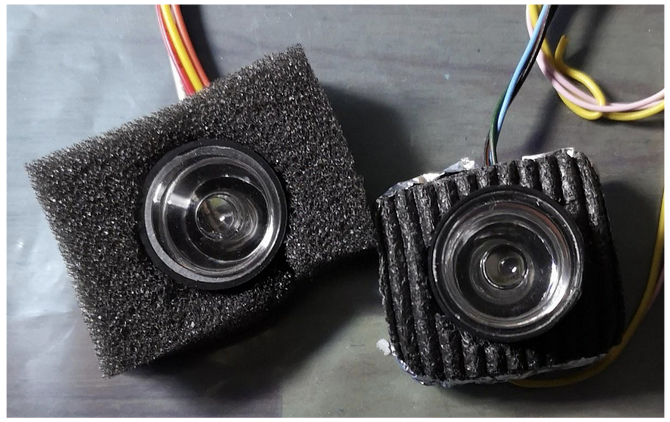
Some of the photodiodes were mounted on a simple circuit board like those employed with the TSL237 in order to measure both sensors in similar conditions of light. The custom-made board is shown in Figure 1.

One of our main interests was the Field of View (FoV) of the TESS-W when using the Hamamatsu sensor. We mounted the sensor with the same optics of the TESS-W photometer, i.e. a light concentrator of around 60o of FoV.

First tests#
The preliminary tests were made by connecting the simple circuit of Figure 2 to the oscilloscope and reading the measures with different brightness levels. The tests were made in a dark room illuminated with diffuse light at low level. Room temperature 20ºC.
{image} /_static/lecture_specific/LICA_hamamatsu/hama_f4.png
:width: 600px
:align: center
:alt: Display of the oscilloscope during the test. Blue line corresponds to TSL337 and the yellow one to the Hamamatsu photodiode
The readings were TSL 0.42 Hz versus Hamamatsu S9705 0.55 Hz. The ratio is 1.30. To know the real gain we need to determine the dark value or offset, see later.
Test on photometer#
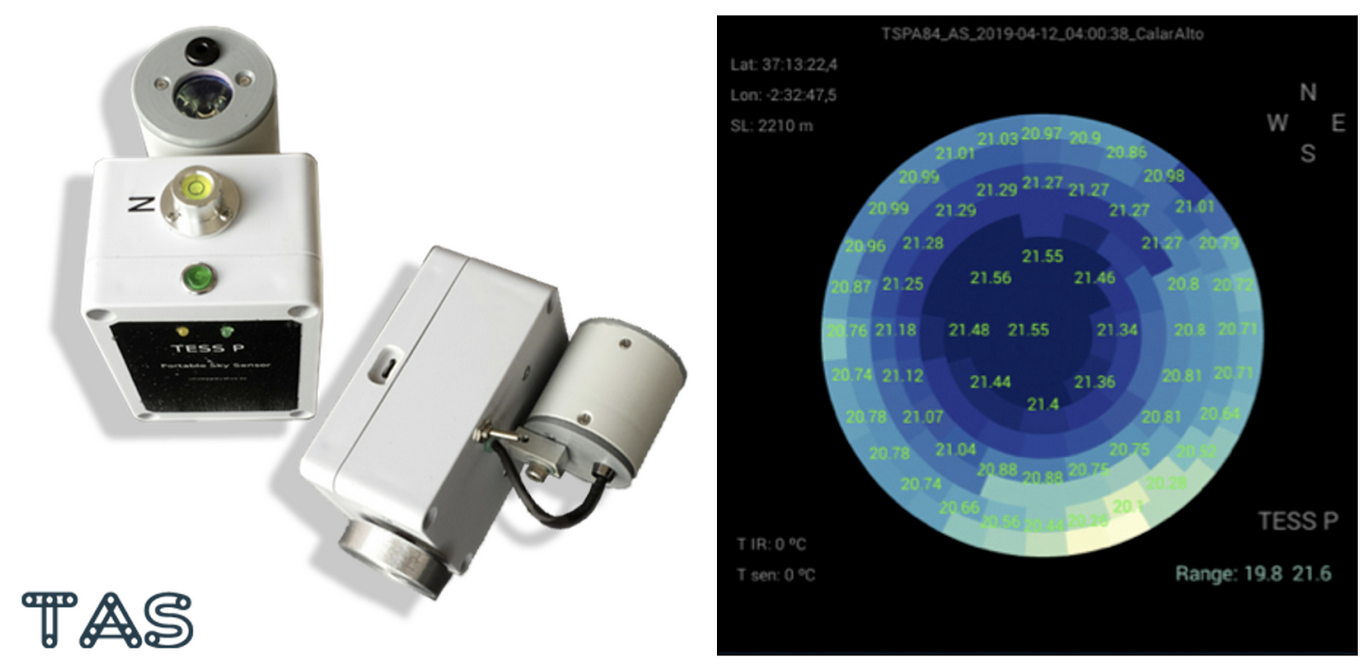
Instead of using a TESS-W for the tests, we used a setup with the TAS (TESS automatic Scan) that allows us to determine differences in sensitivity and also in FoV. TAS (Figure 3) can perform a scanning of the visible sky above the horizon that is useful to build a night sky brightness map. The map shows the brightness at different angles of azimuth and altitude. The sky brightness is measured in magnitudes/arcesec2 which is an astronomical logarithmic unit. The scale is inverse: the darkest the sky, the bigger the value. In the map of Figure 2 the darkest part of the sky is on the zenith (just in the vertical of the site) and some bright values at south are due to the light pollution of Almería, a nearby city.
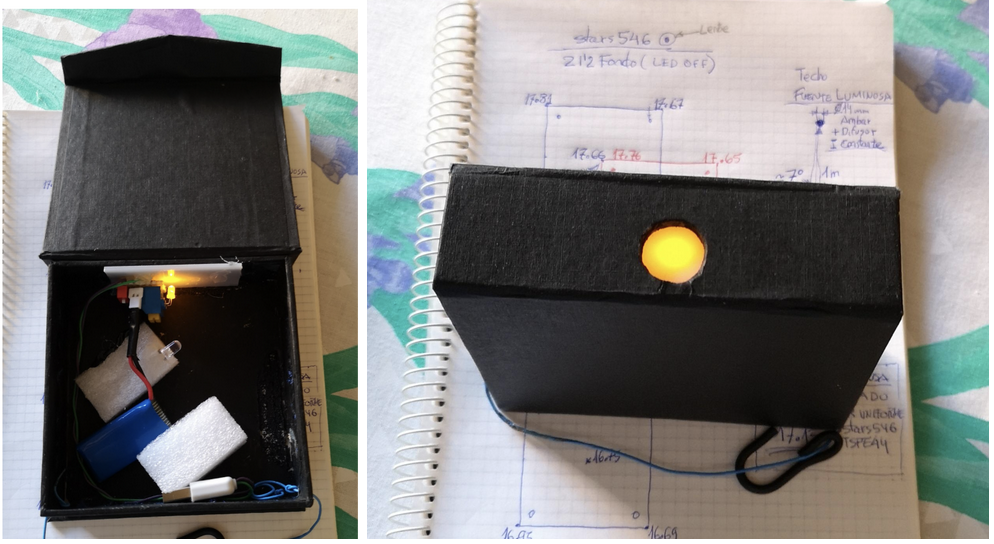
Using a LED we created a diffuse concentrated light source (Figure 6) on the ceiling of the laboratory. We then measured using the TAS photometer with the Hamamatsu S9705-01DT sensor (TASF84) and another one with the AMS TSL237 photodiode (TAS80C). The results are shown at Figure 7.
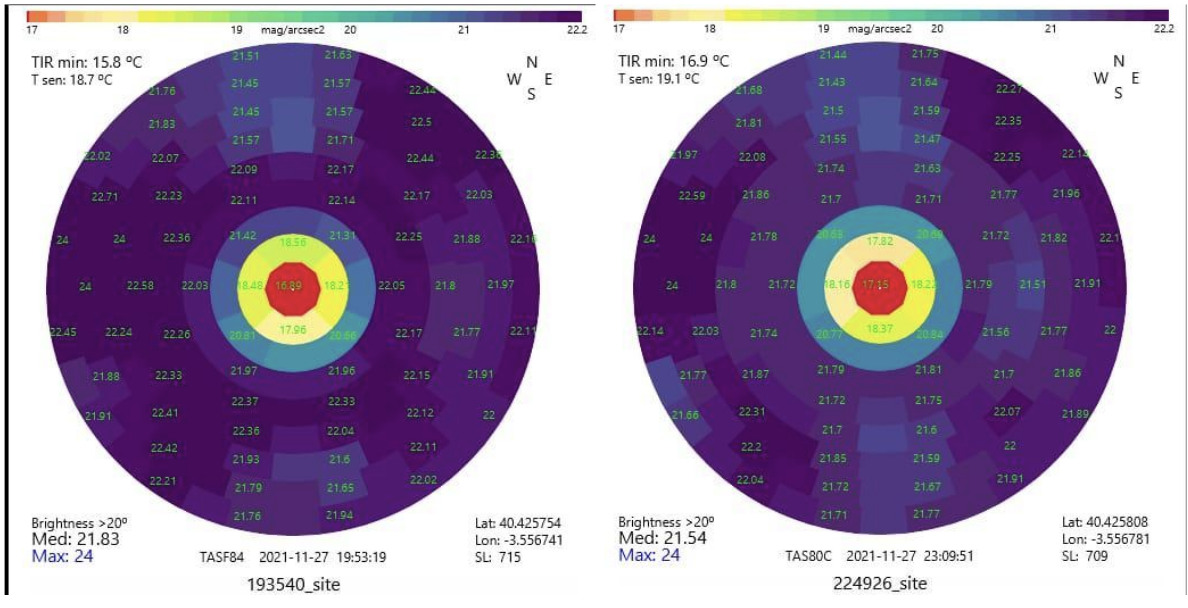
This test yielded very promising results as the values measured with the normal TAS (in frequencies) were 0.77 versus 1.14 with the Hamamatsu TAS. This is a ratio of 1.48, i.e. almost a 50% more sensitivity.
Sensitivity tests#
For the sensitivity comparison we used an integrating sphere. This optical device was illuminated with different brightness levels and the two sensors to be compared were positioned in two ports of the sphere. The results are shown in Table 1.
Table 1 TSL and Hamamatsu sensor comparison
photometer |
1 |
2 |
|---|---|---|
optics |
Collector 60º |
Collector 60º cropped |
Sensor |
TAS TSL |
TAS Hamamatsu |
Serial number |
TAS8C5 |
TASF84 |
Zero-point |
20.42 |
20.81 |
Table 1 (cont.) measurements
test |
magnitude |
f (Hz) |
magnitude |
f (Hz) |
Offset (m) |
Offset (Hz) |
|---|---|---|---|---|---|---|
1 |
17.08 |
21.677 |
17.08 |
31.046 |
0.00 |
0.0 |
2 |
22.17 |
0.1995 |
22.24 |
0.2679 |
0.07 |
0.019 |
A similar value of around 50% efficiency gain is obtained for high brightness (31/22) and around 30% for lower light intensity (0.27/0.20)
Field of View tests#
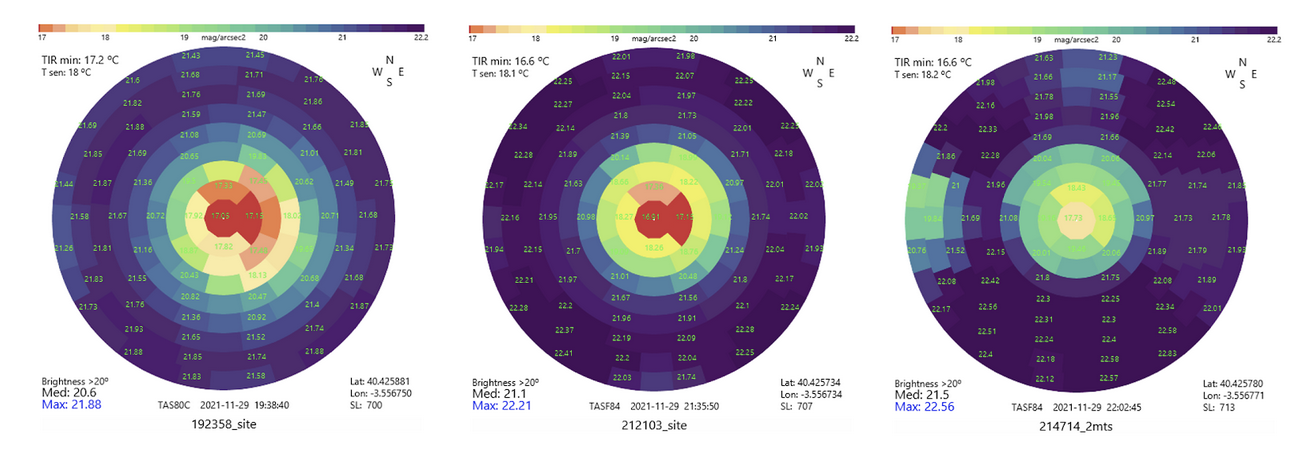
Using similar setup and different light sources we performed more scanning with both TAS to determine the FoV. A sample of these studies are shown in Figure 8 and Figure 9.
Test performed outside the laboratory#
The final tests were performed in the field. The location was nearby Añora (Córdoba) and Peña de San Martín, in a rural dark site similar to check the results with real observations.
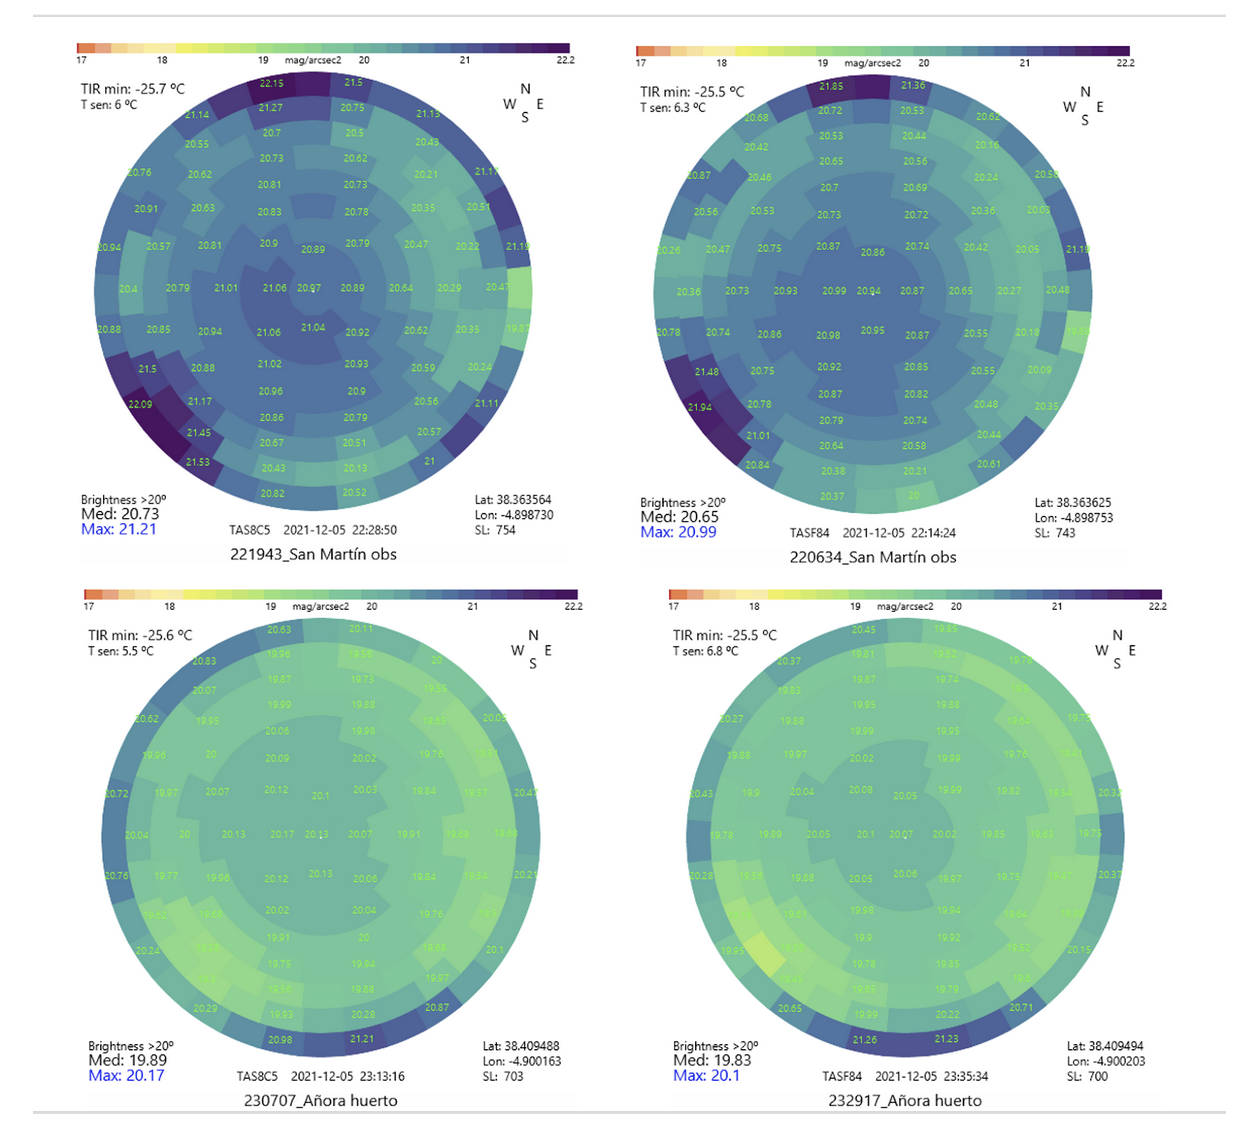
Top maps were obtained at San Martín observatory in a location
with trees in the horizon and a light source in the E direction.
Bottom maps were obtained near Añora (Córdoba) .
Results#
4.1 Sensitivity#
One of the important parameters is the sensitivity since we intend to measure in very dark places. No replacement sensor would be useful if the sensitivity is not at least as good as that of the AMS TSL237. More tests should be performed with several samples and in a range of brightness to check linearity but the tests performed indicate that the S9705-01DT photodiode is between 30 and 50% more sensible depending on the brightness. It should be noted that the AMS TSL237 has a small lens over the photodiode.
4.2 Field of View#
The FoV of the TESS photometer is around 18 degrees (full width at half maximum, FWHM). Using a similar setup with the same collector but slightly trimmed for bringing closer the lens and the sensor, the FoV of a TESS with S9705-01DT photodiode is FWHM = 12 deg. This is not a problem and could be an advantage for mapping devices as TAS that would gain angular resolution. One interesting result is the lack of asymmetry in the angular response of the S9705-01DT photodiode which is also an advantage with respect to AMS TSL237.
4.3 Dark offset#
More tests should be performed with several samples to determine the typical offset value. This is the measure that the sensor yields when no light is present. The offset was high (around 0.1 Hz) in some of our tests (with oscilloscope) while the measures with the complete TAS with the S9705-01DT sensor were 0.02 Hz versus 0.01 of the AMS TSL235.
Conclusions#
Although we still continue performing tests with different samples in different conditions of light brightness levels and temperature, the Hamamatsu S9705-01DT photodiode has shown its capability to be a good replacement for the AMS TSL237 sensor for the TESS photometer and other night sky brightness photometer.
