DSLR as spectrophotometer calibration examples
Contents
DSLR as spectrophotometer calibration examples#
Introduction#
This is a repository showing the results of some tests performed to calibrate a DSLR camera (Canon ESOS 550D) with a difraction rating on the front of the lens as a spectrophotometer. The setup was mounted at Villaverde del Ducado. Different lamps were used for spectral calibration.
Test of 2022/12/30#
For the test of 2022/12/30 we used several LED of different color temperatures. The wavelength calibration was made with the aid of a CFL.
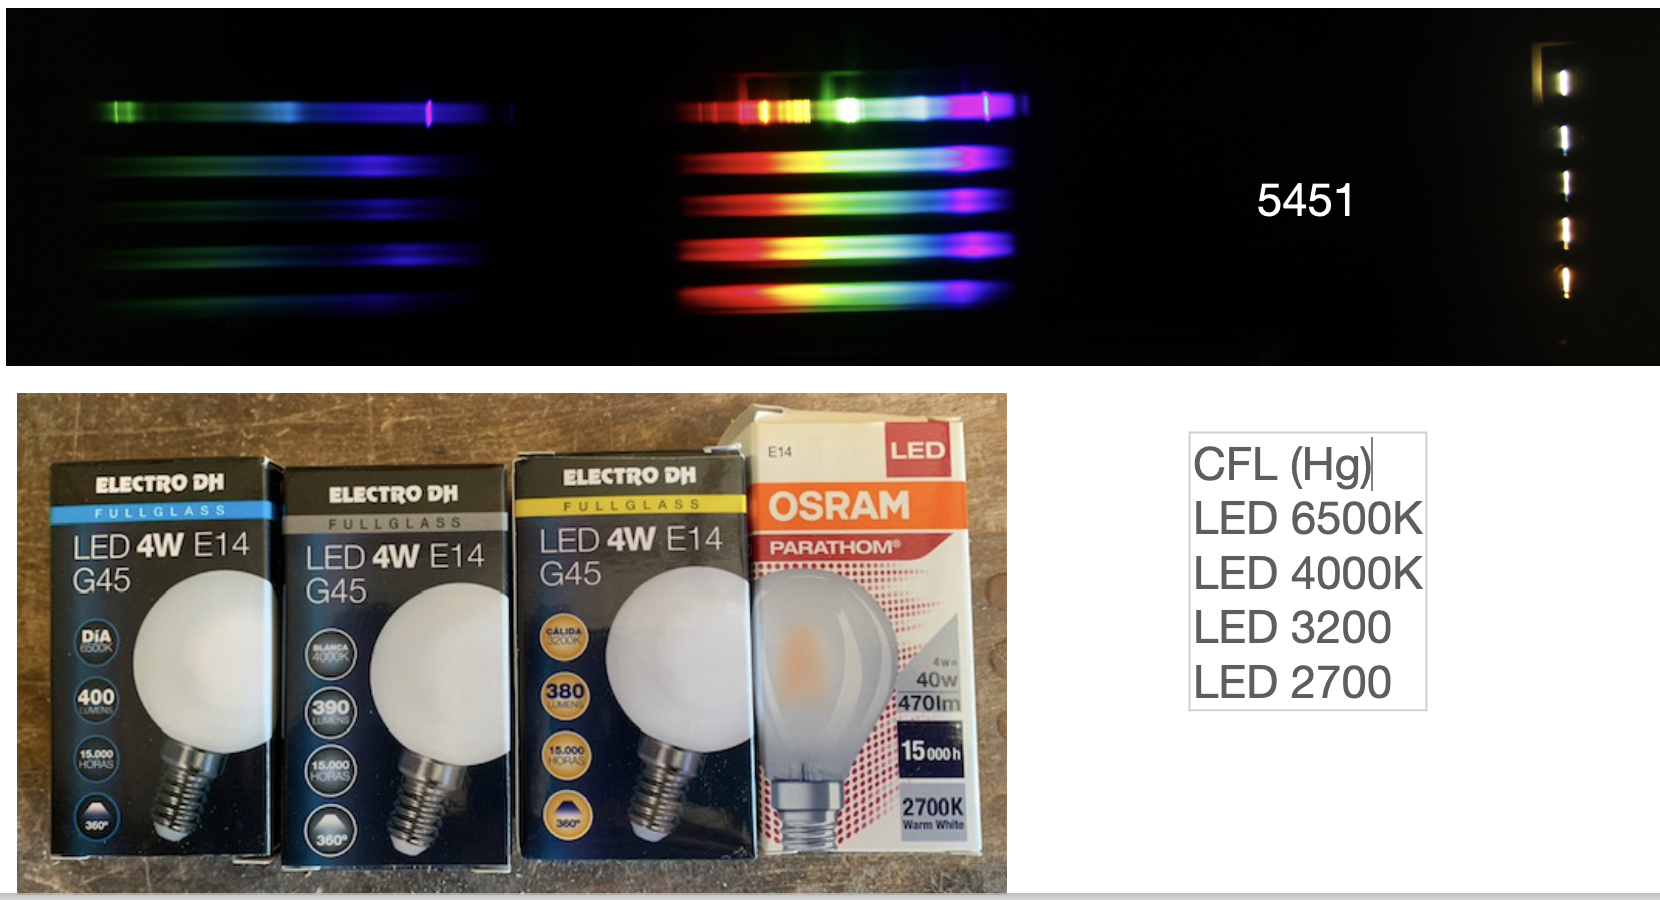
Fig. 94 Spectra and the lamps used in the test of 2022/12/30#
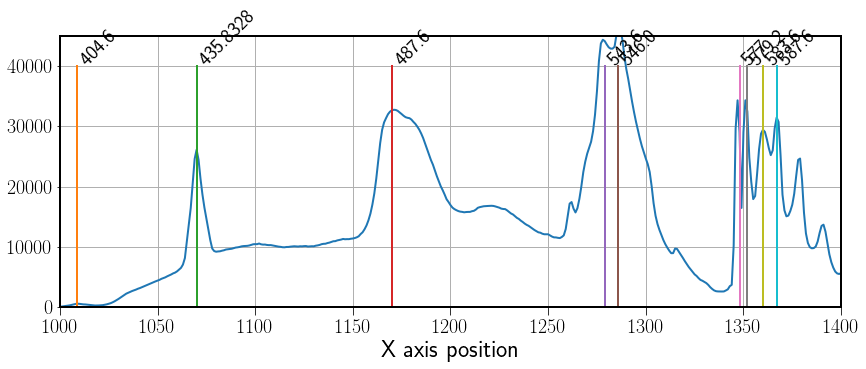
Fig. 95 Identification of the emission lines of the CFL spectrum. Blue region.#
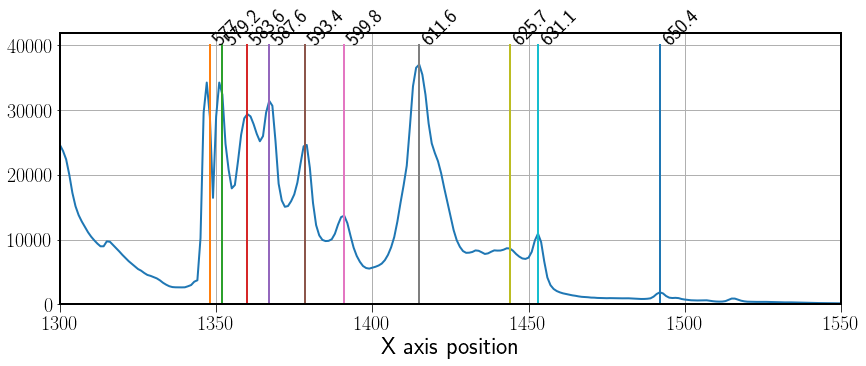
Fig. 96 Identification of the emission lines of the CFL spectrum. Red region.#

Fig. 97 Fit position versus wavelength for the wavelength calibration. On the right the residuals of the fit.#
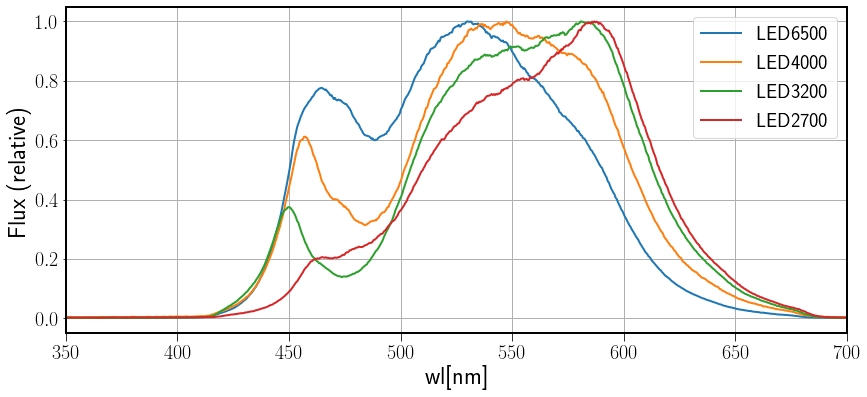
Fig. 98 Wavelength calibrated final observed spectra of the LED lamps used in the 2022/12/30 test.#
Fig. 98 shows the comparison of the spectra pf LEDs of different color temperatura. Note that the peaks in the continuum spectra are not located in exactly the same wavelegth region.
The LED lamps used in this test are not available at the UCM-LICA database. To determine their spectra we have used a Sekonik C-3000 spectrophotometer.
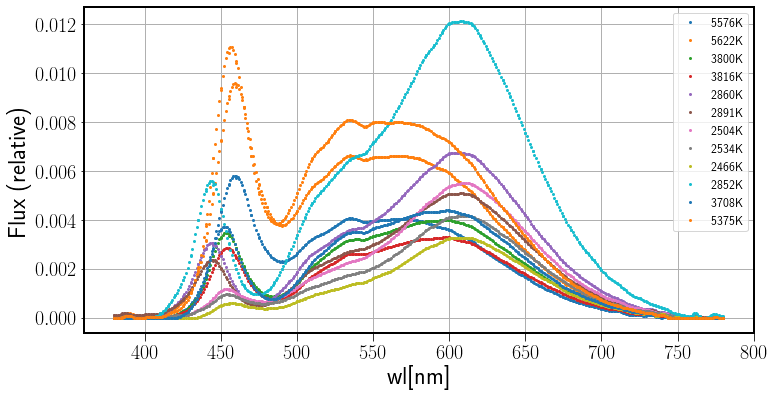
Fig. 99 Spectra of the LED lamps used in the 2022/12/30 test obtained with a Sekonik-C3000 spectrophotometer.#
It is interesting to note that (a) repeated observations of the same lamp provides different color temperature and (b) this color temperature is lower than the nominal temperature, i.e. that displayed in the box.
nominal |
1 |
2 |
3 |
|---|---|---|---|
2700K |
2466K |
2504K |
2534K |
3200K |
2860K |
2891K |
2852K |
4000K |
3800K |
3816K |
3708K |
6500K |
5375K |
5576K |
5622K |
Other interesting result is the lack of enough signal in the blue region (even for the 6500K LED) for calibration purpouses (see Fig. 99 and Fig. 100). A bluer light source is needed for comparison.
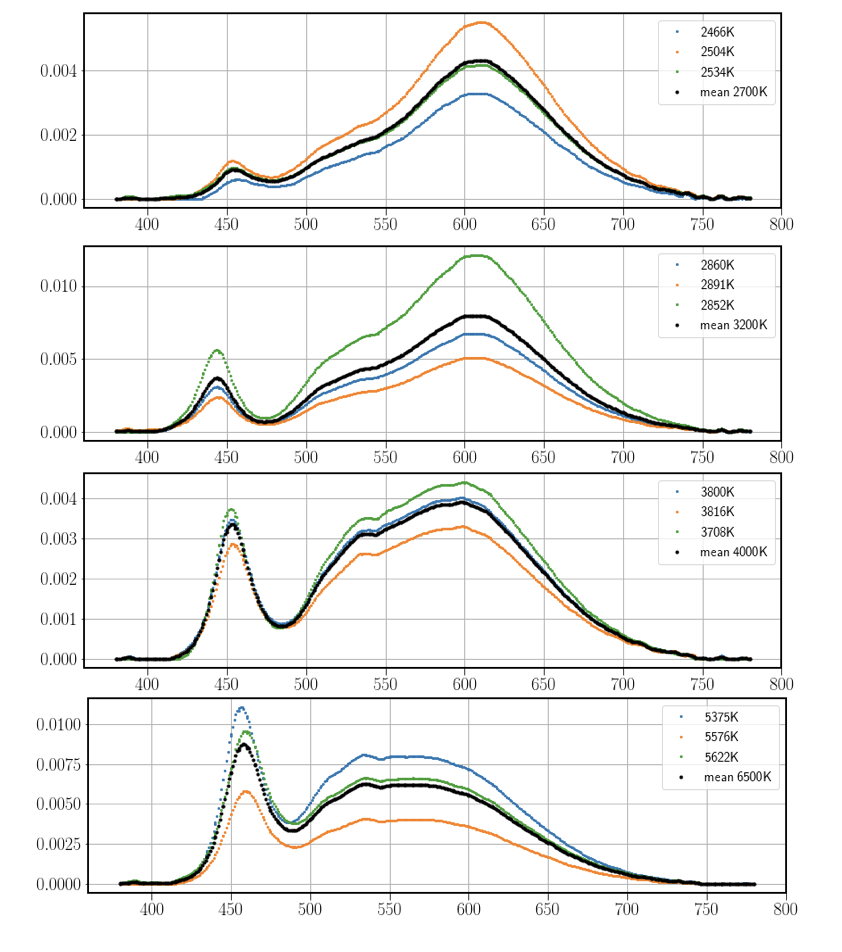
Fig. 100 Individual and mean spectra for the different LED lamps used in the 2022/12/30 test obtained with a Sekonik-C3000 spectrophotometer.#
After the comparison of the observed spectrum and those measured with the spectrophotometer as a reference we can find the response curve.
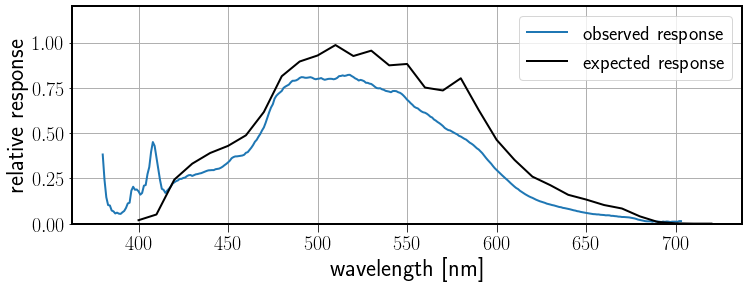
Fig. 101 Observed and expected response using a LED 6500K.#
The result is still not satisfactory in the blue part of the spectrum.
Test of 2023/01/02#
For the test of 2023/01/02 we used nothe white LED of 6500K (nominal color temperature) and a very white CFL that can be used for wavelength calibration but also for photometric calibration.
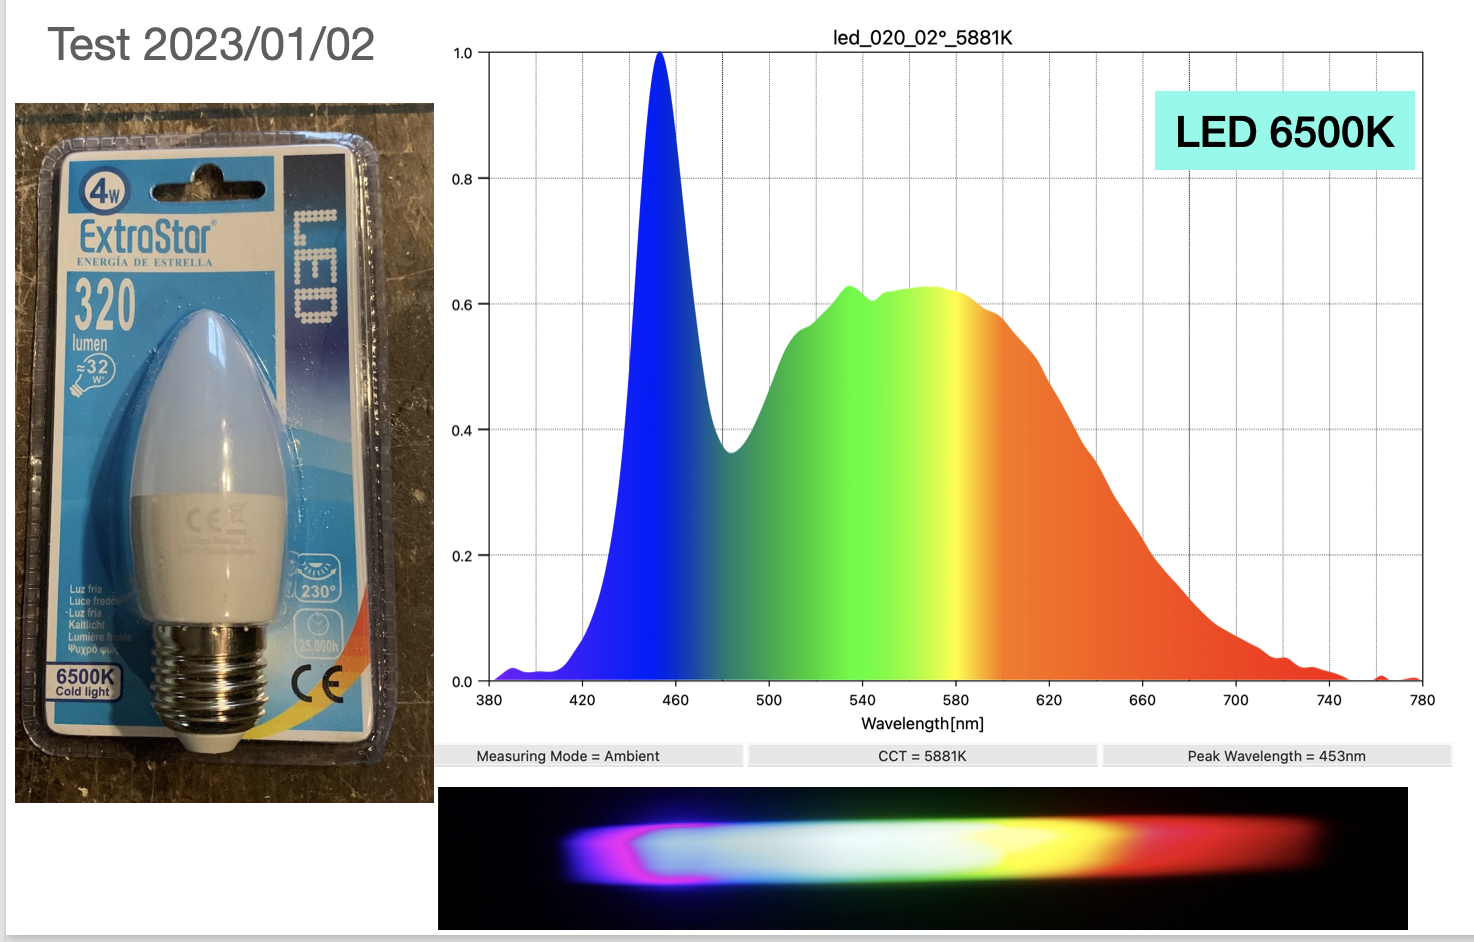
Fig. 102 CFL lamp and its spectrum as recorded in the test and with Sekonik C-3000 spectrophotometer for the 2023/01/02 test.#
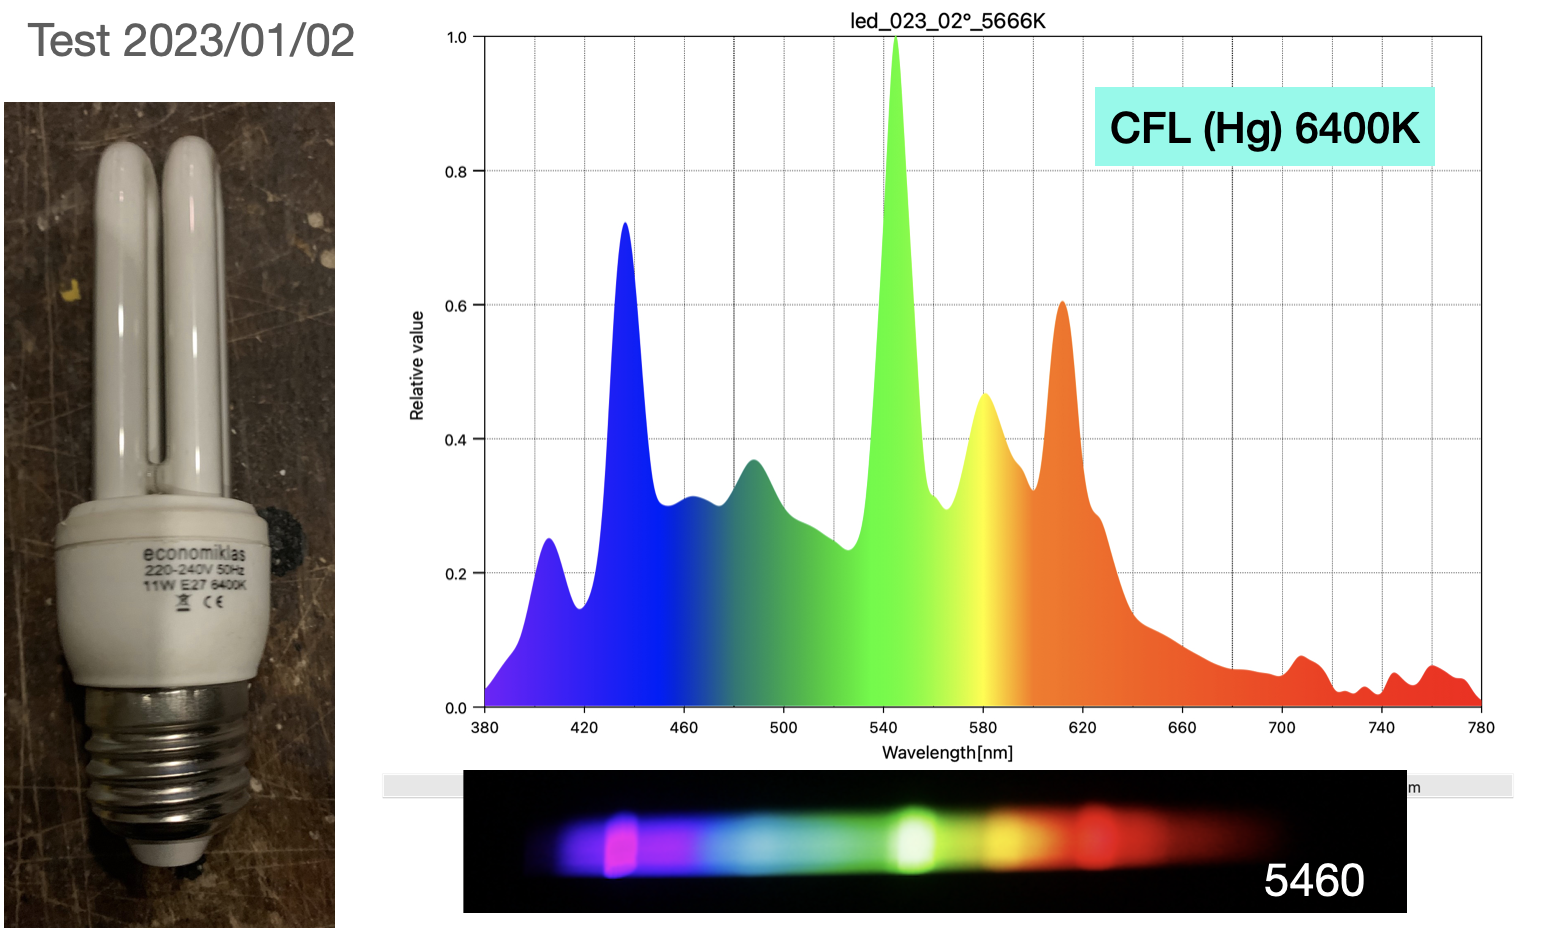
Fig. 103 CFL lamp and its spectrum as recorded in the test and with Sekonik C-3000 spectrophotometer.#
Note the emission of the CFL lamp in the 380-420 nm wavelength range.
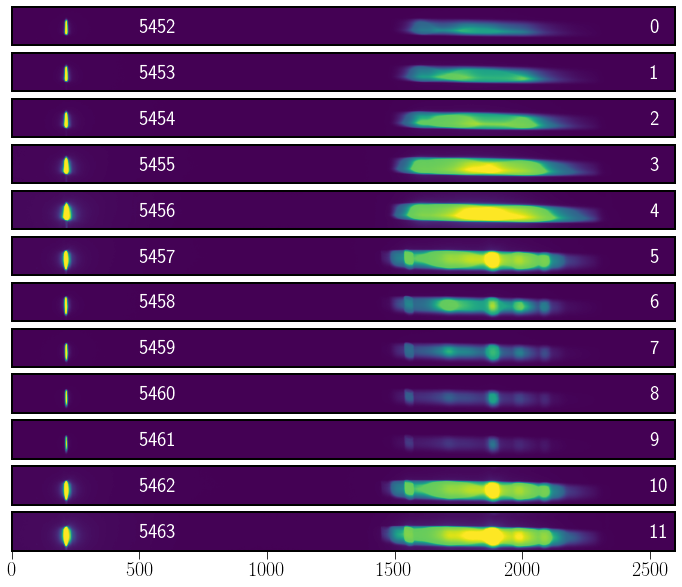
Fig. 104 Bidimensional spectra for the whole series of observation 2023/01/02. Not reproduced with the same scale.#
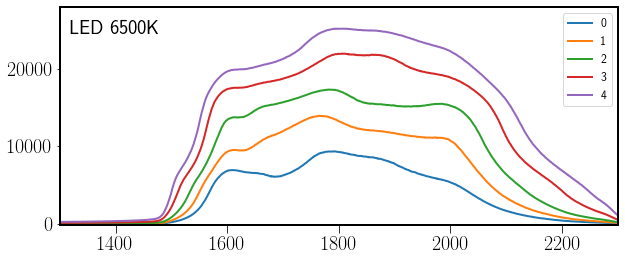
Fig. 105 Monodimensional spectra for the LED 6500K observation of 2023/01/02.#
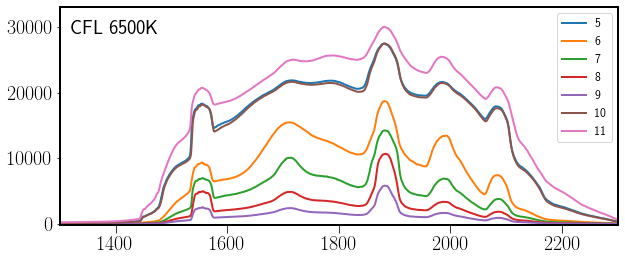
Fig. 106 Monodimensional spectra for the CFL 6500K observation of 2023/01/02.#
The CFL spectra is rather defocused but it is enought to perform wavelength calibration.
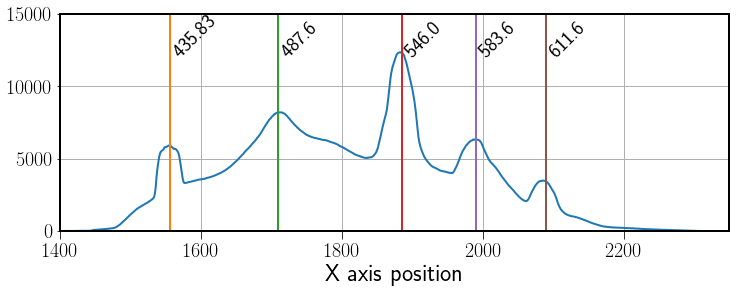
Fig. 107 Mean CFL 6500K spectrum with lines identified.#
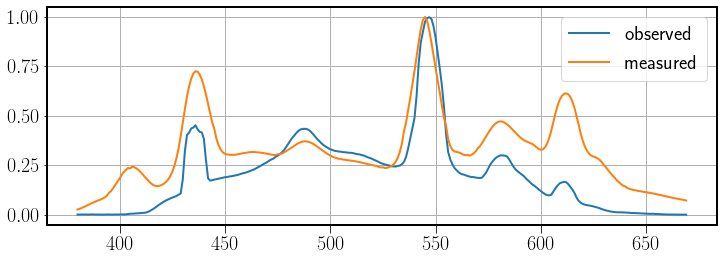
Fig. 108 Mean CFL 6500K spectrum observed and measured with Sekonik C-3000 spectrophotometer.#
Warning
The test should be repeated with a better focus to get a proper response curve
Test of 2023/01/10#
This test was performed by Ignacio Hilera. He used several LED of different color temperatures and two CFL.
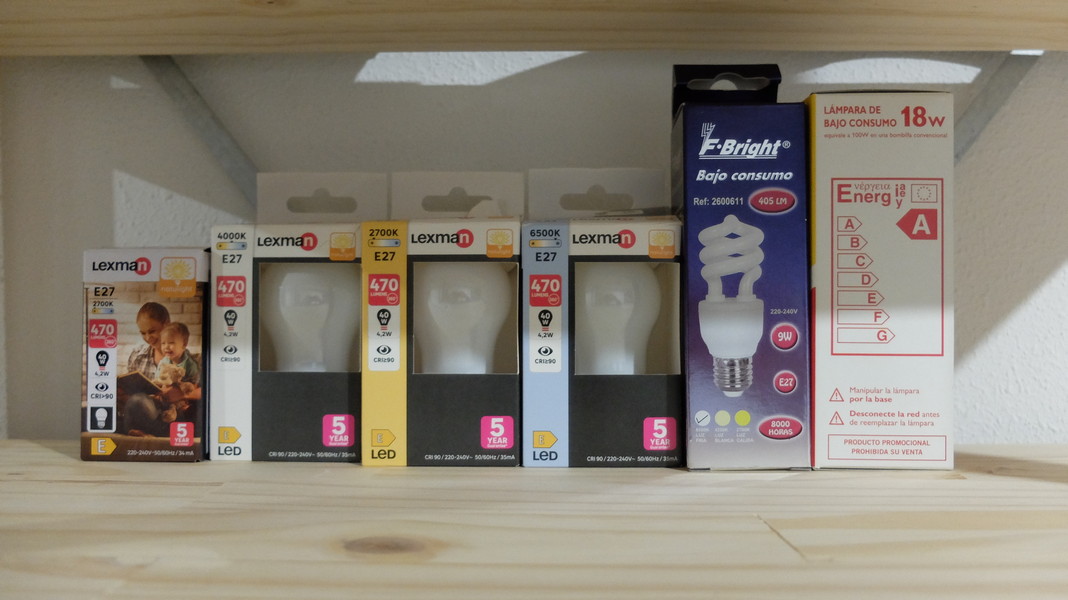
Fig. 109 Lamps used in the 2023/01/10 test.#
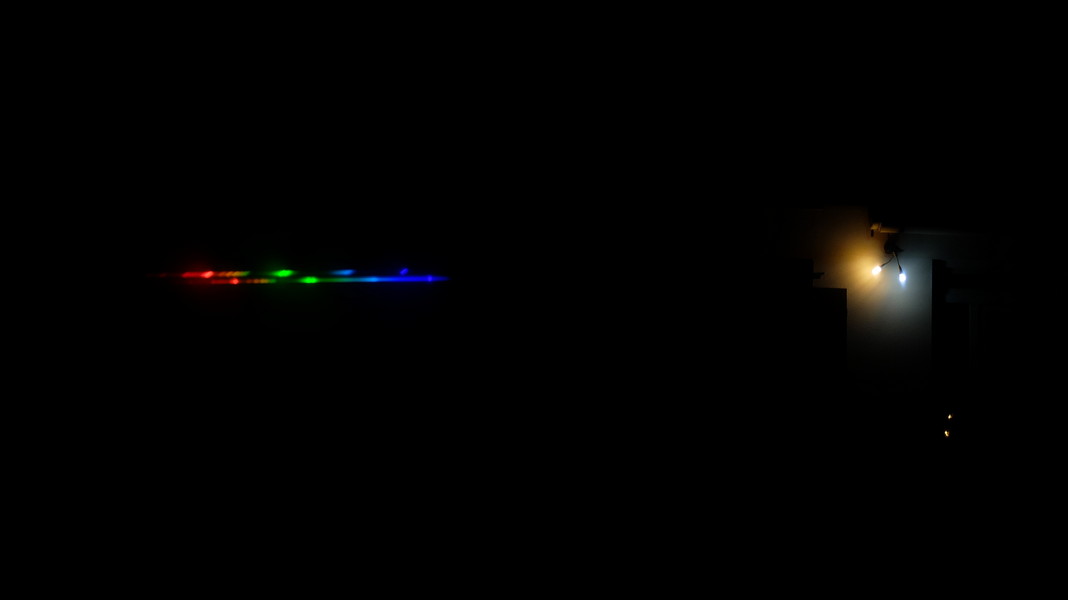
Fig. 110 Clip of picture DSC7310 with two CFL lamps of different temperature.#
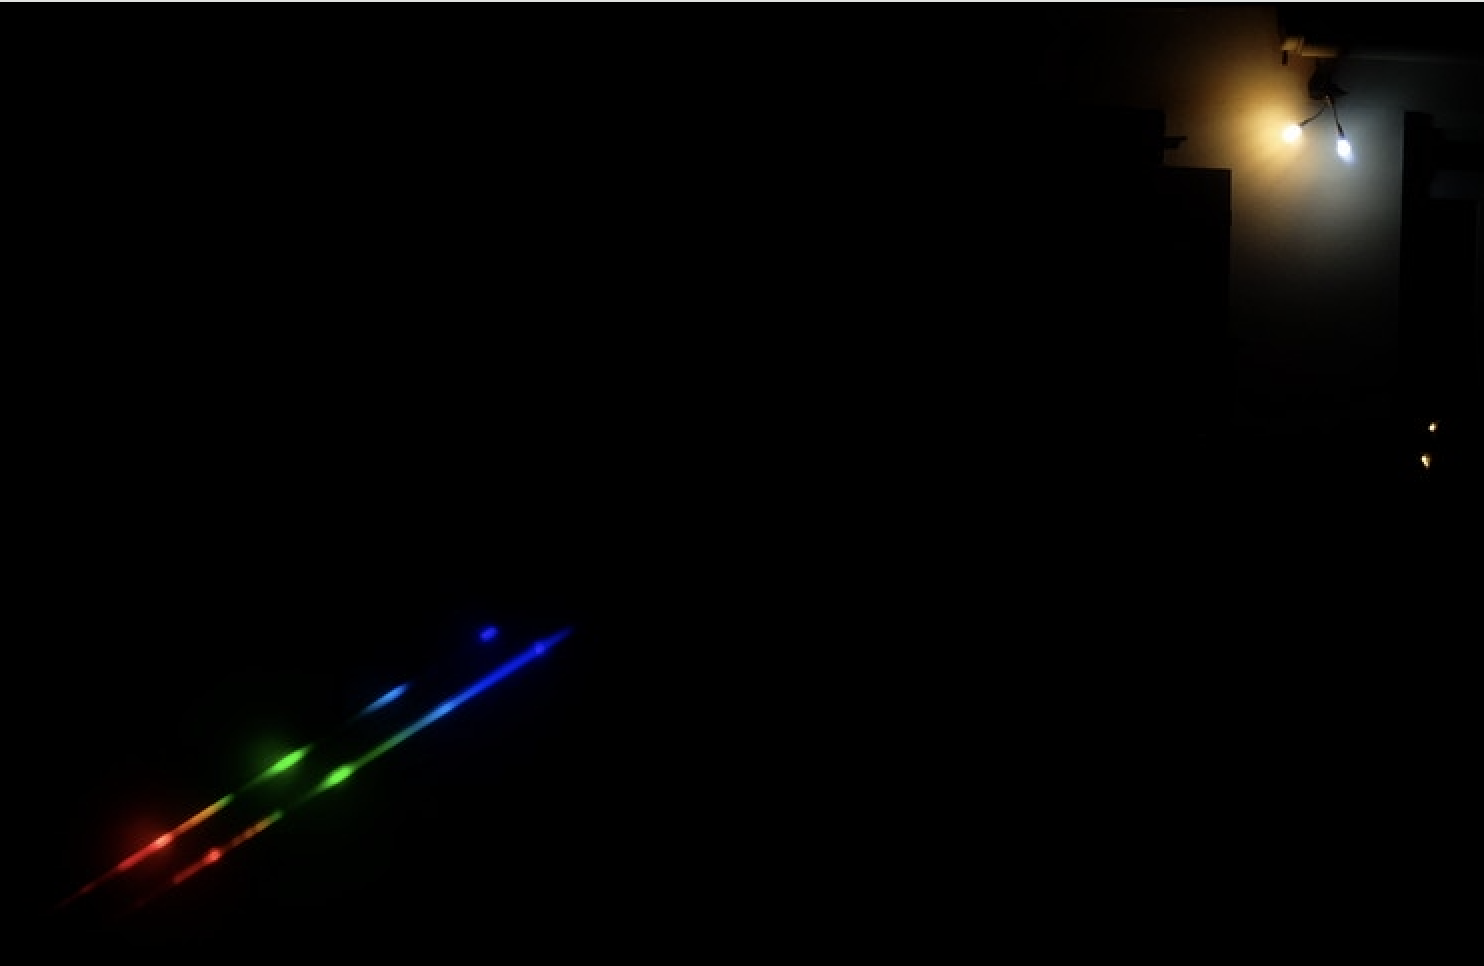
Fig. 111 Clip of picture DSC7311 with two CFL lamps of different temperature.#
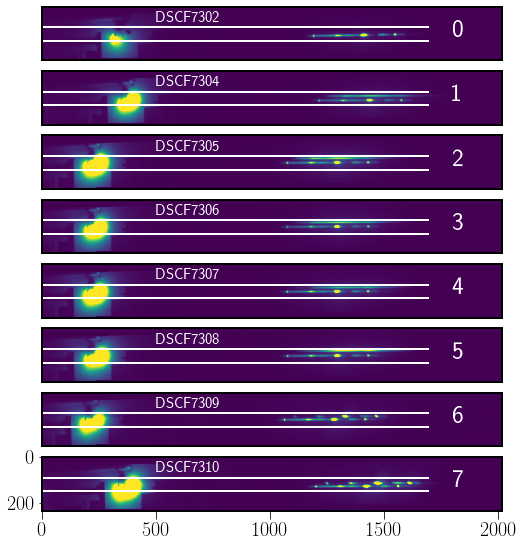
Fig. 112 Clips of pictures.#
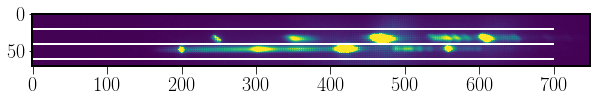
Fig. 113 Clip of DSCF73100 with two CFL spectra.#
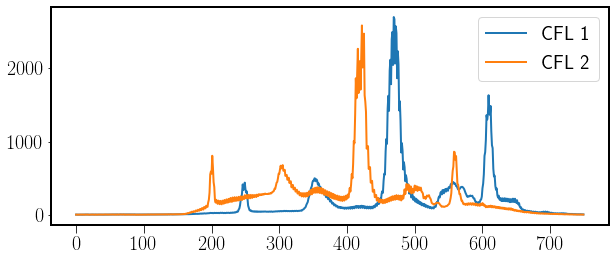
Fig. 114 Monodimensional CFL spectra of picture DSCF7310.#
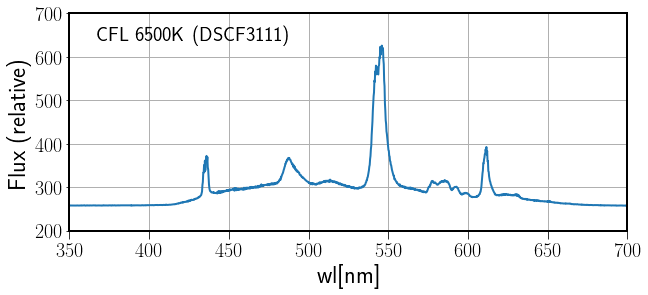
Fig. 115 Mono dimensional CFL spectrum of picture DSCF7311 with lines identified.#
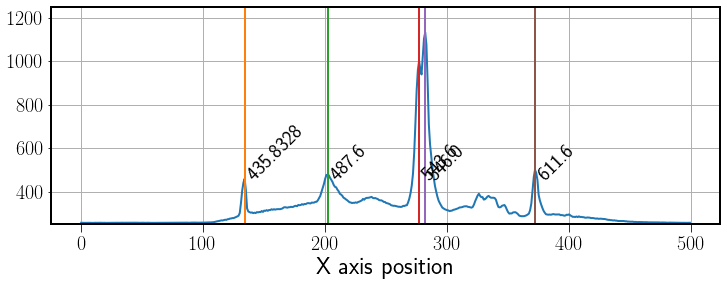
Fig. 116 Mono dimensional CFL spectrum of picture DSC7310 with lines identified.#
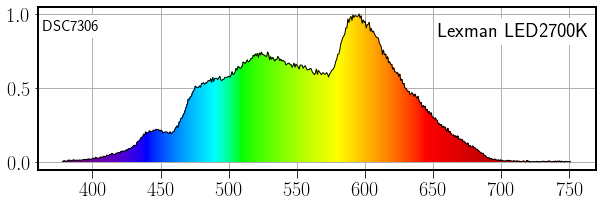
Fig. 117 Mono dimensional Lexman LED2700K spectrum of picture DSCF7306.#
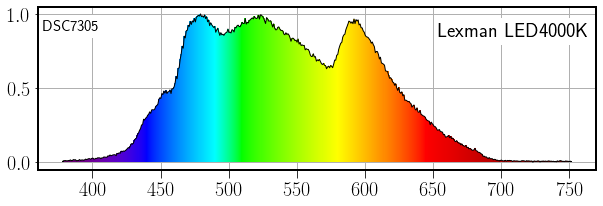
Fig. 118 Mono dimensional Lexman LED4000K spectrum of picture DSCF7305.#
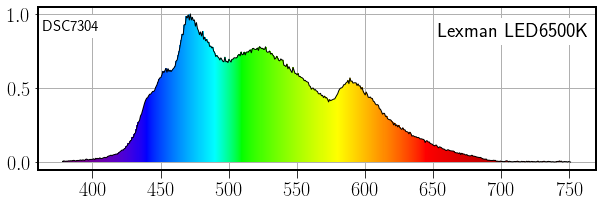
Fig. 119 Mono dimensional Lexman LED6500K spectrum of picture DSCF7304.#